
How do streamers know if their live stream connection is healthy?
There are a lot of factors that go into a successful live stream. In a simplified summary of the process, you (the streamer) publish your video to an ingest endpoint using a protocol like RTMP, and an ingest server is listening on the other end, transcoding and muxing that media into a consumable format for viewers.
When you’re a live streamer, a lot of the complexities of this process are abstracted away from you. The things you do control (besides actual content) are your recording equipment and the encoder software that packages up the video and sends it to a live stream ingest destination.
So — you’re recording, and the encoder is sending your video out into the internet…but how do you know if your content is being successfully ingested?
There are a few solutions to this challenge. You could inspect the network health of your ingest stream. That provides a good indicator for network-related issues, but it also requires technical expertise to inspect traffic and to even know what is “good.” You also won’t catch classes of problems that stem from encoder configuration mistakes; your network could be perfectly healthy while your encoder is misbehaving.
You could also visually inspect your stream. This is a great “black box” observability solution: the best way to know if your live stream is working well is to, well, see how the stream is playing back. However, this won’t narrow down the issue much. Is there a problem with transcoding? Delivery CDNs? Or is it actually your encoder (the thing you can control directly)? It can be difficult to identify the source of the problem by simply viewing the stream.
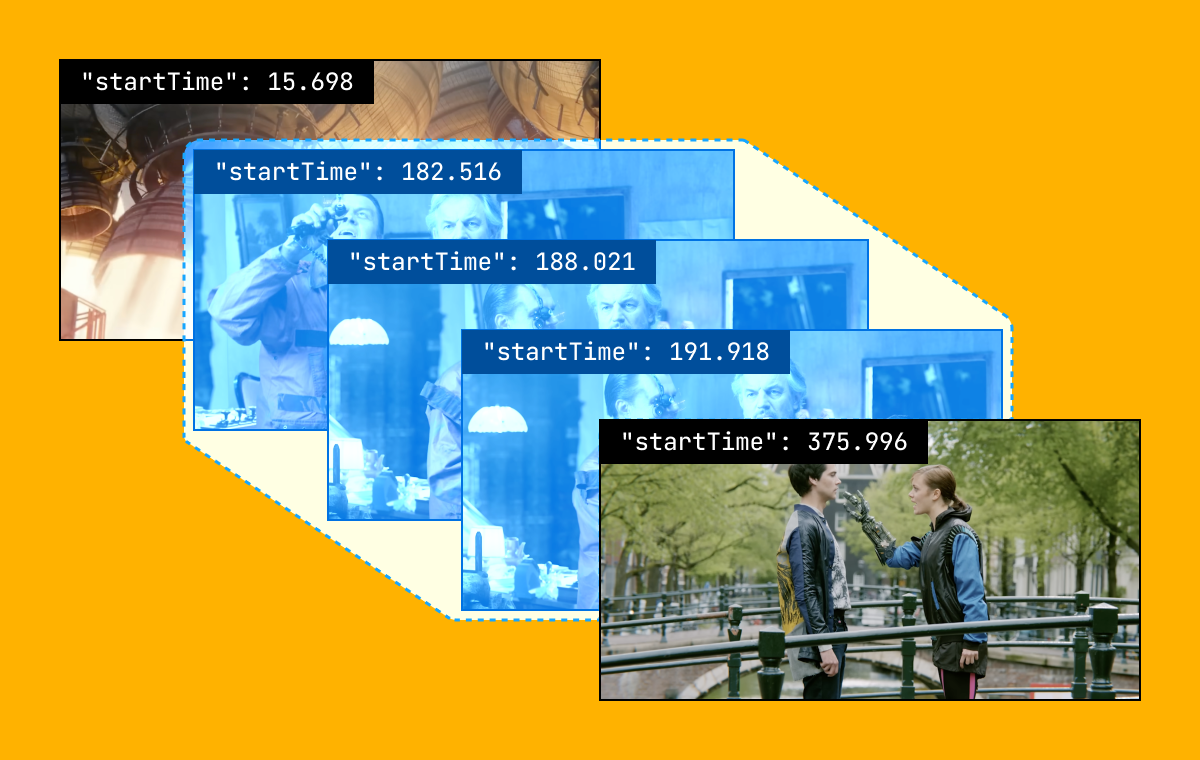
To know whether your stream encoder is successfully connecting and sending video to the live stream ingest, you really want the ingest system to provide a feedback loop into the content it is processing. Is it receiving anything at all? Does the media have the expected audio and video bitrate? Are valid media timestamps being sent?
Here at Mux, we are pleased to announce a new ingest health API feature that provides that exact feedback loop. Any time you (or your users) publish video to a Mux live stream ingest, this API will provide a summarized indication of how healthy the ingest is. We believe a single indicator value provides immediate, lightweight information that streamers can use to know whether they need to troubleshoot their connection. To start, this API will return measurements of stream drift.
What is stream drift?
Stream drift measures the difference between the duration of an encoder connection and the duration of media received during the course of that connection. Say you begin a new live stream and are connected and sending video for 600 seconds (10 minutes). If you send 550 seconds of live video during that time, your current stream drift would be 50 seconds.
Stream drift can even be negative — imagine you record a 60-second segment before connecting to the live stream ingest. Once you’re connected, that “back buffer” is sent to ingest in addition to any newly recorded live content. This means your encoder might actually send more than 600 seconds of media, and the current stream drift value would be negative. In a somewhat mind-bending way, the media is progressing faster than wall-clock time from the ingest’s perspective.
What happens to stream drift when an ingest session is unhealthy? Let’s imagine something is going on with your local network, causing the encoder to send video bytes at a snail’s pace (note: some encoders will respond reactively by adjusting bitrate in relation to network conditions). In this case, less media time will be received by the ingest server. Stream drift starts increasing over time because the ingest server’s wall clock continues normally but media timestamps are not advancing at the same rate.
Next, let’s imagine your network recovers and you begin sending media at real time. Your stream drift will stop increasing and will start flattening out because both the ingest server’s wall clock and your encoder are now progressing at real time. If you visualize stream drift over time for your stream, a healthy stream is one that has a “flat” stream drift line.
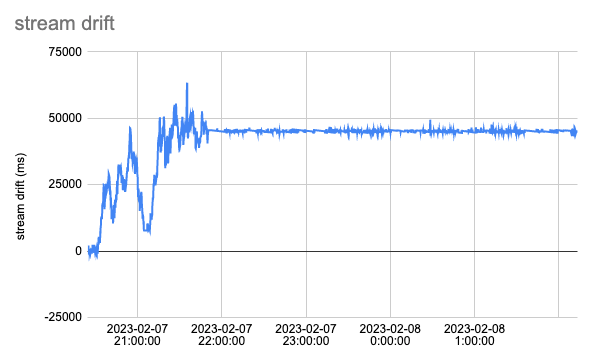
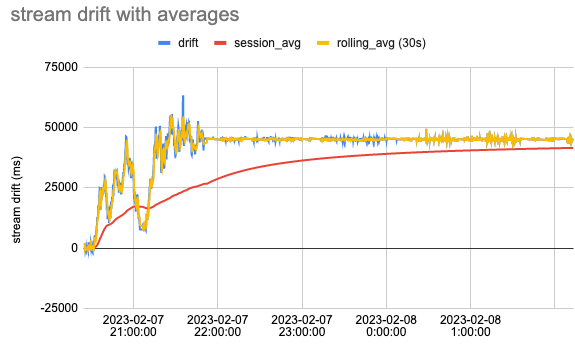
Consider the above example. In the first hour or so of this live stream, stream drift fluctuates quite a bit and grows over time to roughly 50 seconds until it eventually flattens out around 22:00:00. There was likely some issue that prevented the encoder from successfully sending media to the ingest until the first stream drift “peak.” The encoder was able to start backfilling some video, but stream drift eventually rose again to the second peak. After a while, the streamer was able to resolve these issues, and ingest processing was likely mostly healthy thereafter.
Reduce complex data to simple summaries
It’s pretty easy to see when stream drift is suffering if you have a chart over time and you accept that “flat” stream drift is good. However, always loading and displaying a chart of stream drift can be heavyweight and potentially complex to understand for certain audiences. What many streamers might want is a simple answer to the question “is my livestream working well or not?” Is there a way to distill stream drift metrics over time into a single indicator estimate of current quality?
Calculating averages of metrics can give us a summarized understanding of metrics over time. However, given the time-sensitive nature of live streaming (we care about stream quality now, not 30 minutes ago), simple averages can be easily skewed by “old” data points. Instead, we can calculate moving averages that describe stream drift over windows of different sizes in a couple ways.
One formula calculates the session average: For all data points collected so far, what was the average stream drift value? This provides a smoothed value for the lifetime of the connection and gives an observer information about the relative timing offset between the ingest clock and media time.
The other average is a rolling window: For all data points in the last period (we’re starting off with ~30s of data), what was the average stream drift value? This provides an aggregated metric for what stream drift looked like recently. Here’s the same chart with these averages plotted:
Let’s reconsider the goal of getting a single, real-time indicator of ingest health. If the current value of stream drift differs significantly from the rolling average, then the encoder is likely falling behind. Thus, our new API also returns the current deviation from the rolling average stream drift. Let’s see what this looks like if charted (compared to the original stream drift chart):
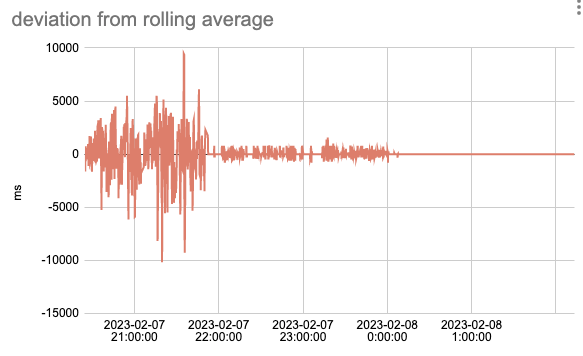
The amplitude of the deviation from the rolling average metric line is much greater during the periods when the live stream is having drift issues. Once these issues are resolved, the deviation values approach zero.
In a nutshell, the deviation reflects the ingest health for that moment in time, while the session average represents the stream drift throughout the whole session. These variables help us answer the questions “how is the stream right now?” and “how is the stream overall?” This is why the new API we’re releasing returns the following values: session average stream drift, deviation from rolling average stream drift, and a simple string status that estimates whether your live stream ingest is healthy (based on deviation from rolling average). You can find the docs for how to use this API here.
Give your broadcasters confidence in their connection
By calling the Live Stream Health Stats API, you can now get both high-level health status and stream drift metrics, which you can build into your application.
For example, if you want to provide a color-coded UI indicator to your streamer so that users are aware of whether the live stream ingest is still connected, you can use the status value the API returns — i.e., “excellent,” “good,” “poor,” and “unknown” — and map them into green, yellow, red or gray traffic lights. If you are building a tool for operational purposes and want to monitor and control your encoder, you can surface the stream drift metrics so that your users get more details. You may also log and store this data for historical reporting purposes.
The API is available today in Public Beta to all Mux Video customers at no additional charge. We are excited to see how you will use this API to build your applications, and, as always, we are here if you have feedback.