Your most critical metrics. One real-time view.
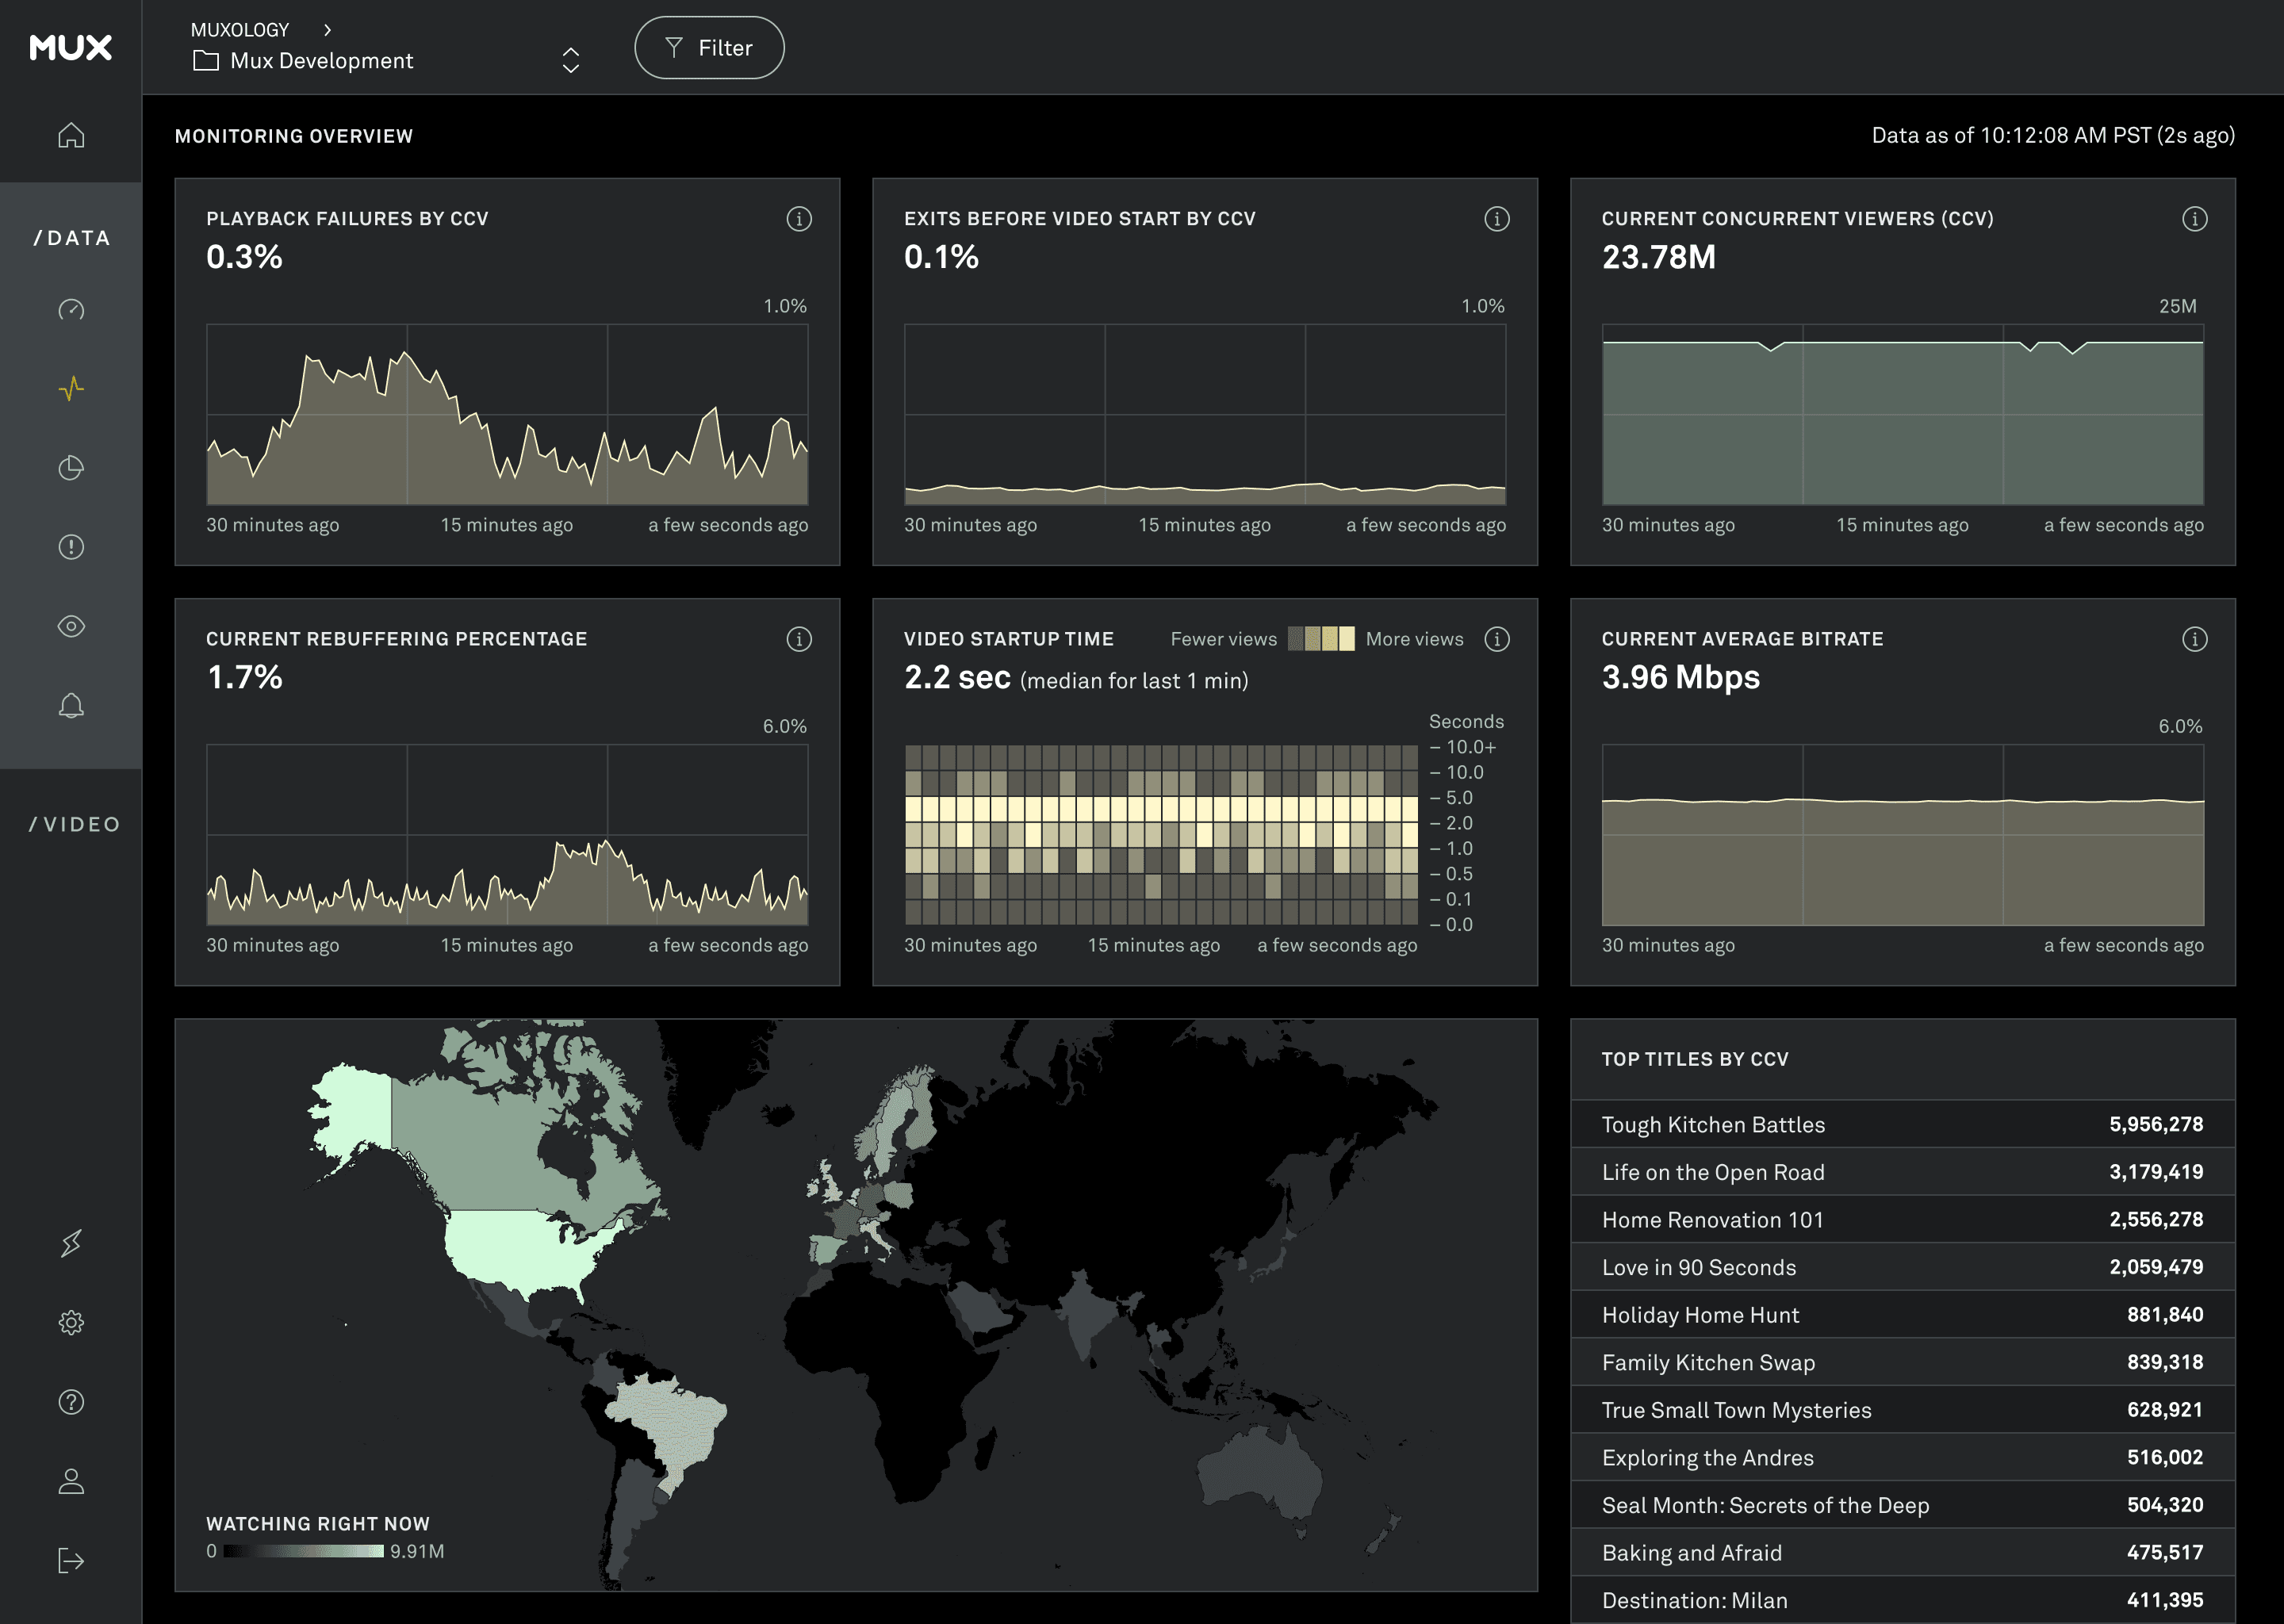
With the most essential metrics, greater data granularity, and smart visualizations, the Monitoring Dashboard provides video platform operators with a virtual command center for monitoring and optimizing the viewer experience.
Real-time means real-time
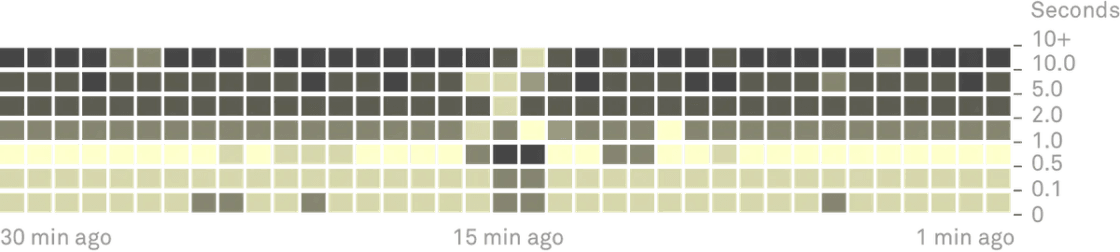
Get clear, actionable insights with industry-leading speed. Intuitive data visualizations illustrate trends over time and allow you to explore individual issues to better understand their impact.
Committed to transparency
We show our math: See how each metric is calculated directly on the dashboard. Mux’s pricing is straightforward, so you always know what you’re paying for.
Integrate in hours, not weeks
Get up and running almost instantaneously with easy-to-use SDKs and an API created by a team of video experts. Collect Quality of Experience (QoE) metrics with out-of-the-box, certified integrations for most video players and platforms.
See the dashboard in action
Built for your command center
Operational command centers are often dark environments with too many screens that overwhelm instead of inform. The Monitoring Dashboard is designed to give you just the right amount of contrast, content, and scalability to accommodate any television or monitor size, so it’s easy to find the right data at the right time.
Answers to key questions.
At a glance.
Similar to our Quality of Experience metrics, our monitoring helps you answer the questions that are vital to the health of your platform and viewer experience.
- Did we break anything with our recent player update?
- Which geography is having connection issues?
- Which CDN is struggling?
- Is the football game’s live stream rebuffering?
- How is my streaming platform handling the millions of people watching the show’s premiere?
Solve problems with actionable insights
Take advantage of automated insights to quickly pinpoint any QoE issues so you can see what’s happening and why. You can stop guessing and start digging into the exact metrics you’re interested in with our real-time filters.
Arm customer support with data
Improve customer support with insight into individual video views and user sessions. Empower your support teams with an accessible dashboard complete with up-to-the-second data.
No withholding here
Your data is yours, and you should be able to access it how you want. Mux makes it easy for you to get to your data in multiple ways, without limitations or surprise fees.
- Monitor metrics in a beautifully designed and user-friendly UI.
- Access historical and real-time data through restful APIs, and schedule daily CSV exports of your data.
- Integrate seamlessly with the data streaming tools you already use, like Amazon Kinesis, Google Pub/Sub, and other destinations like Snowflake and BigQuery.
- Share Mux Data with your vendors (like CDNs) to drive problem resolution.
No credit card required to start using Mux.