Faster, scalable video QoE data
With just a few lines of code, you’ll get the data you need at world-leading scale. Understand streaming analytics, monitor user engagement, and improve the quality of experience (QoE) for your viewers.


Behind the world’s largest scale
Understand what viewers experience no matter how many people are watching. With Mux Data, you can rely on the infrastructure that supports the world’s largest streaming events, reaching even tens of millions of concurrent viewers.
End-to-end visibility. Including CMCD.
Get visibility on everything from the player to ads to CDNs, and evaluate every piece of your video workflow. With easy-to-integrate technology, like CMCD, you can tie your QoE analytics together with your CDN performance logs to pinpoint the causes of viewer issues or see the impact of ads and ad servers on your viewers’ experience. With tons of standard and custom dimensions, you can track the full picture of your video workflow.
Expertly built. Expertly supported.
Expertise matters. And the Mux team comes from the best of the best in video: The founders built Zencoder and Video.js and run the world’s premier video engineering conference, Demuxed. With a support team built around industry experts, you can easily get questions answered and understand every metric as you go.
Your data, fit for your needs
Your data is yours, and you should be able to use it however you want. Access historical and real-time data through restful APIs, schedule daily CSV exports of your data, and integrate seamlessly with the tools you already use, like Amazon Kinesis.
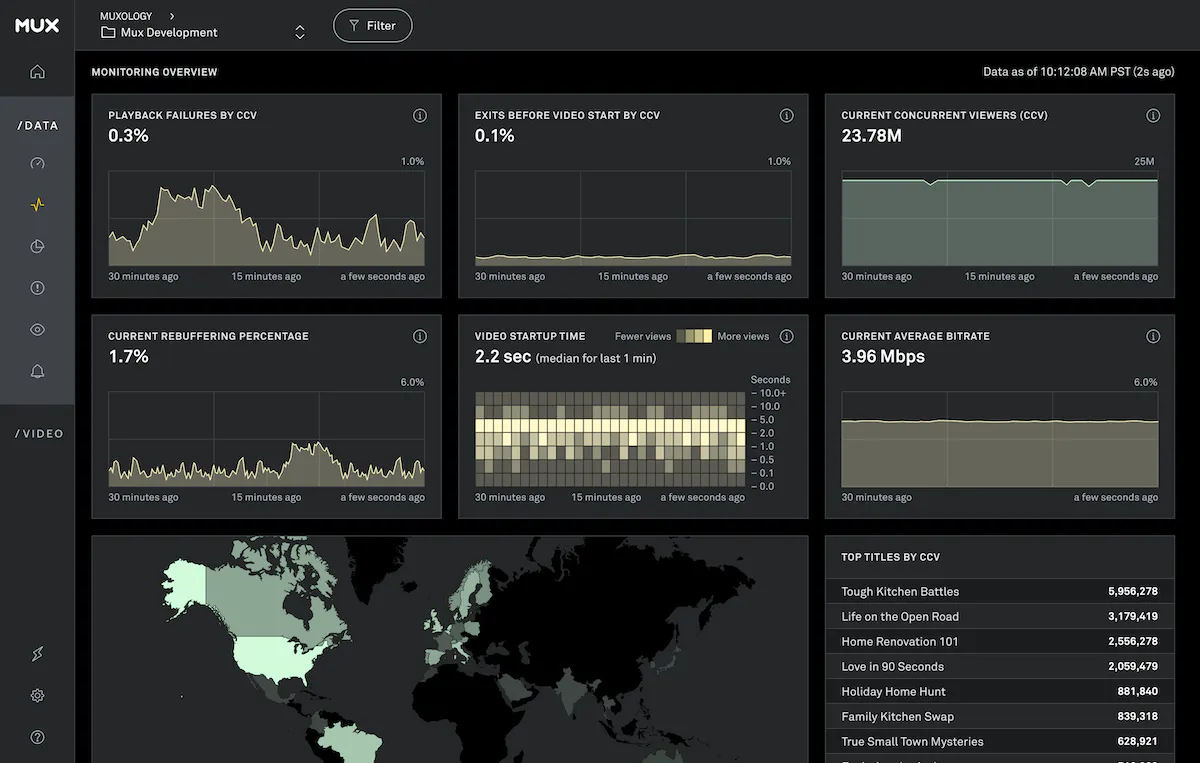
Actionable insights. Industry-leading speed.
Monitor critical metrics in real time through a single, operational dashboard — so you can handle major streaming issues before your support team is overwhelmed. Plus, you’ll get the insights fast, with a lower latency than any alternative in the industry.

Understand your performance at a glance
Monitor the key dimensions of video quality of service (QoS): playback failures, startup time, rebuffering, and video quality. With Mux’s industry-first viewer experience scores, you can quickly summarize your video platform’s performance on a daily or weekly basis. Benchmark your metrics against other Mux customers to help understand where you have the biggest potential for improvement.
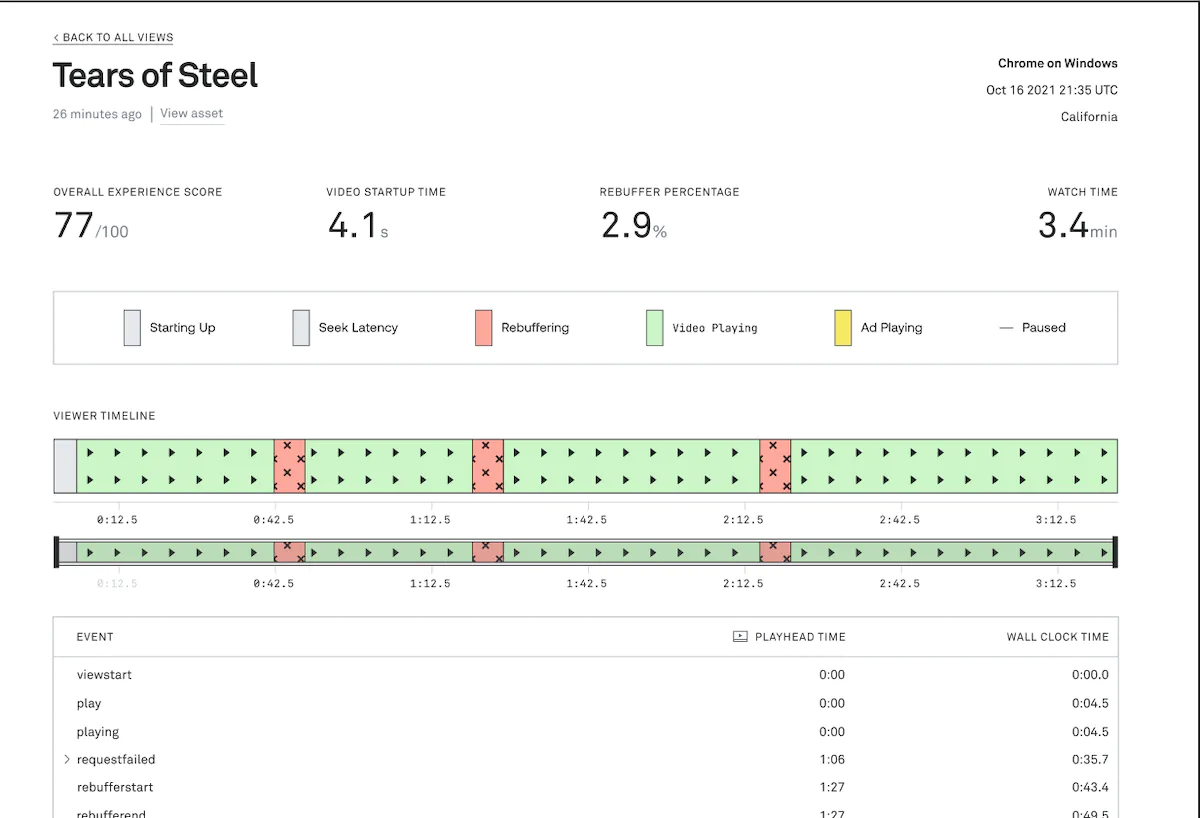
See what’s happening (before users do)
Get alerts when something goes wrong, and use Mux’s powerful dashboard to dig deeper. Track video playback down to the individual view level, so your engineering and support teams can know exactly what’s happening on every user’s device and debug more effectively.