
In order to deliver great video, development teams big and small need easy-to-use tools to monitor video experience and user engagement. Only when armed with data are you able to identify what content is working and where the user experience needs work.
In fact, when we started Mux, we built and launched Mux Data to provide those insights before doing anything else. Over time, we developed Mux Video to give development teams an API for video, and we even used Data internally to measure the performance and experience for viewers.
We listened to a lot of developer feedback on how to make using Video and Data together simpler and more valuable. Here's a roundup of the improvements we've made that combine the superpowers of these products, to support developers building amazing video experiences.
- We launched an API for real-time engagement data, so you can build real-time view and unique viewer counts into your apps—whether to enrich the viewer experience, or provide internal visibility into how your videos are performing. Developers using Video and Data together, regardless of their plan, can also see real-time engagement counts for each asset and live stream in the Video dashboard.
- It's now easier to use Data and Video together. We now automatically display video asset ID, playback ID, and livestream ID into Data, and made it easier to jump between Data and Video.
- As a reminder, if you're already a Video customer, monitoring your streams with Data is included in your plan. And of course, you can also use Data if you're not using Video - we support a broad range of players. Take a look at our docs to learn more.
Here we'll dive deeper into these new points of connection between Video and Data.
Real-time Engagement API: See how many people are watching your video
The Real-Time Streaming Dashboard, currently available in our Media Data plan, is a powerful tool that helps operational teams monitor their video platform. In addition to providing visibility into the Quality of Experience delivered, the dashboard also provides real-time metrics on audience engagement like views and concurrent viewers.
This information is so useful that we launched a beta of the Real-Time Engagement API. Any developer building with video can get real-time views and unique users data about their audience, and use it to enrich the player experience and inform internal audiences with robust reporting applications.
There are two data points available:
- Views: the current number of sessions that are currently streaming. This number could include a single viewer watching the same video from more than one location.
- Unique viewers: the number of unique viewer IDs that are viewing a stream. This number will be lower than the number of views if, for example, there is a single viewer ID watching from multiple locations.
We also used the API internally to build real-time data into the Video dashboard. If you're using Data and Video together, check the Video dashboard to quickly see audience engagement.
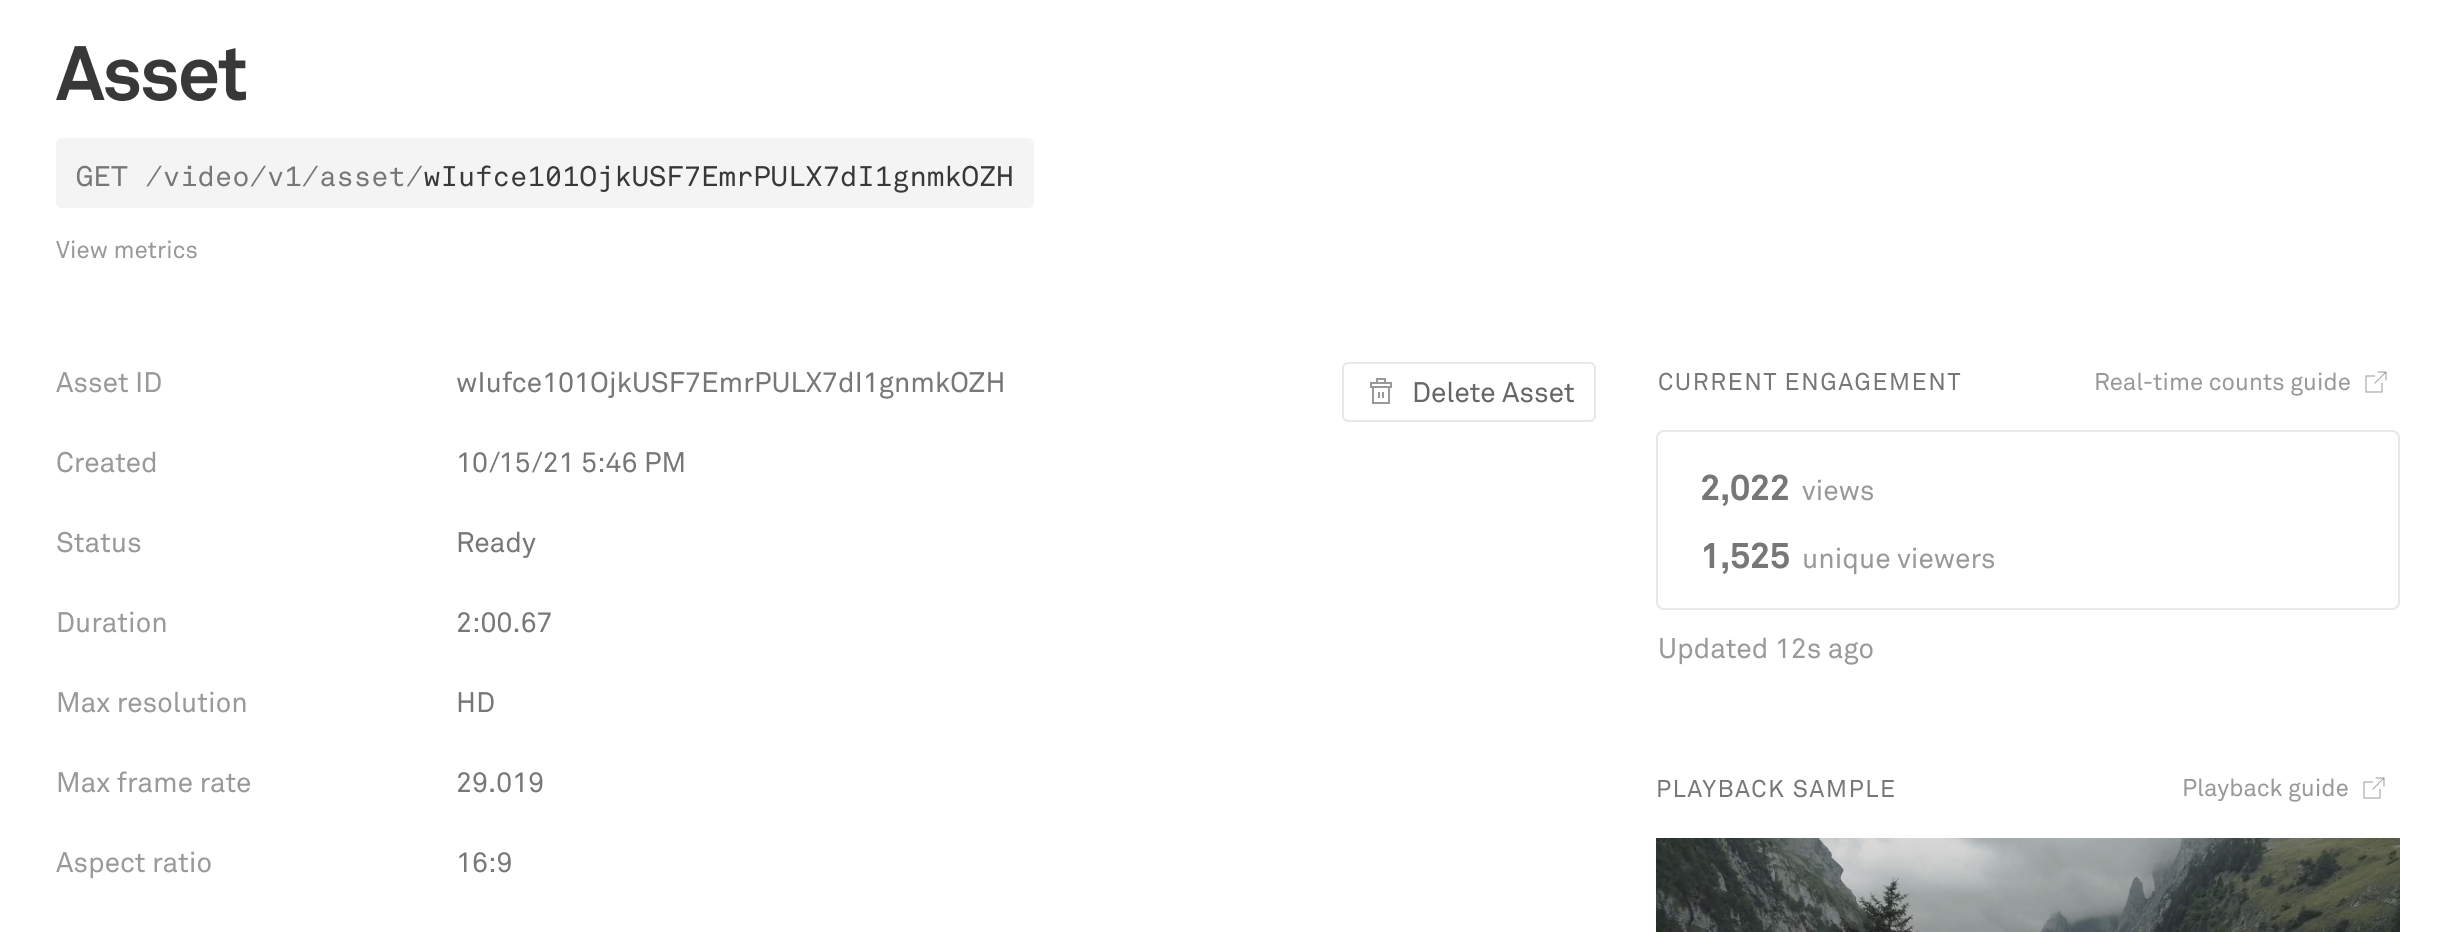
To see the engagement counts for assets and live streams, just go to the Asset or Live Stream page and select "Current Engagement" on the right rail. You'll then get a count of current views and unique visitors, which updates every fifteen seconds.
If you see this blue box when you log in to your account, it means you haven't yet deployed Data. Make sure you integrate it to get visibility and insight into viewer engagement and their experience.

Making it easier to use Video and Data together
We've simplified the experience for Video users to view and report their Quality of Experience and engagement data in Data.
Previously, asset ID, playback ID, and livestream ID weren't automatically ingested into Data, which made it hard to jump between products. We are now automatically populating all of these IDs for historical and real-time reporting, so developers can report on the historical Quality of Experience and engagement data of their Video streams.
Video data in Metrics and Real-Time Streaming Dashboard
The Metrics reporting page provides Data users with insights on the Quality of Experience and engagement across all of their video views. Users will often want to aggregate on the asset ID to see how many views an asset has gotten over the last month.
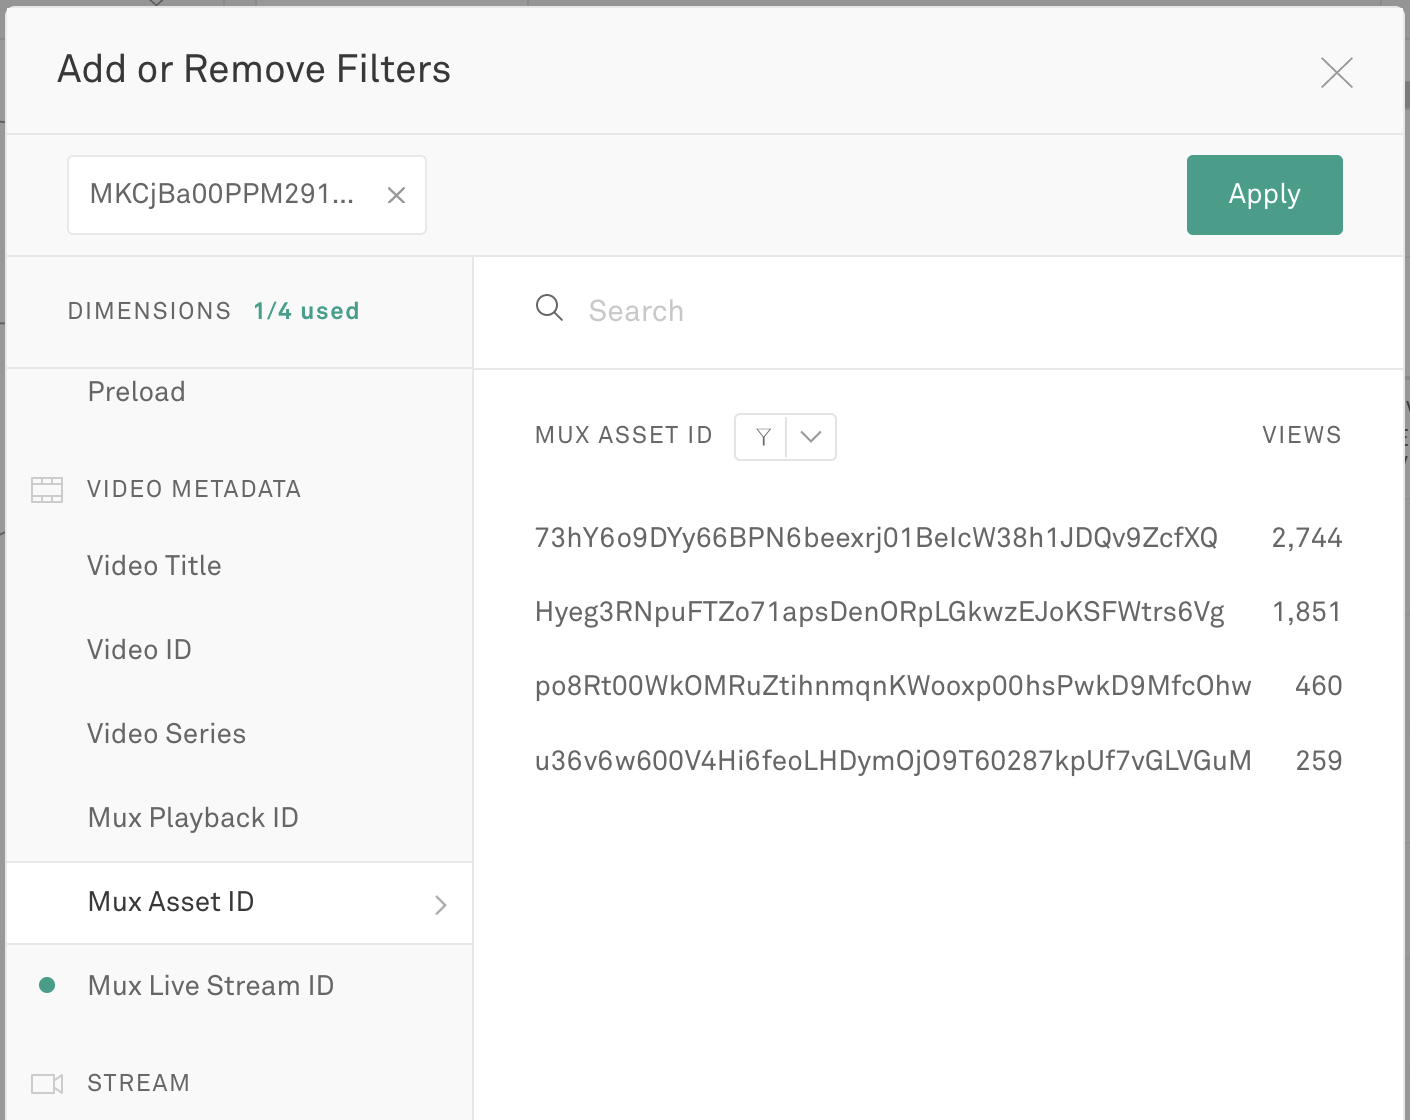
To make reporting easy, dimensions are now available for playback ID, asset ID, and live stream ID across the historical analytics for Metrics, Views, and Errors. In the Metrics Breakdown tab, you can report on aggregate experience and engagement for the specific video streams you want to track.
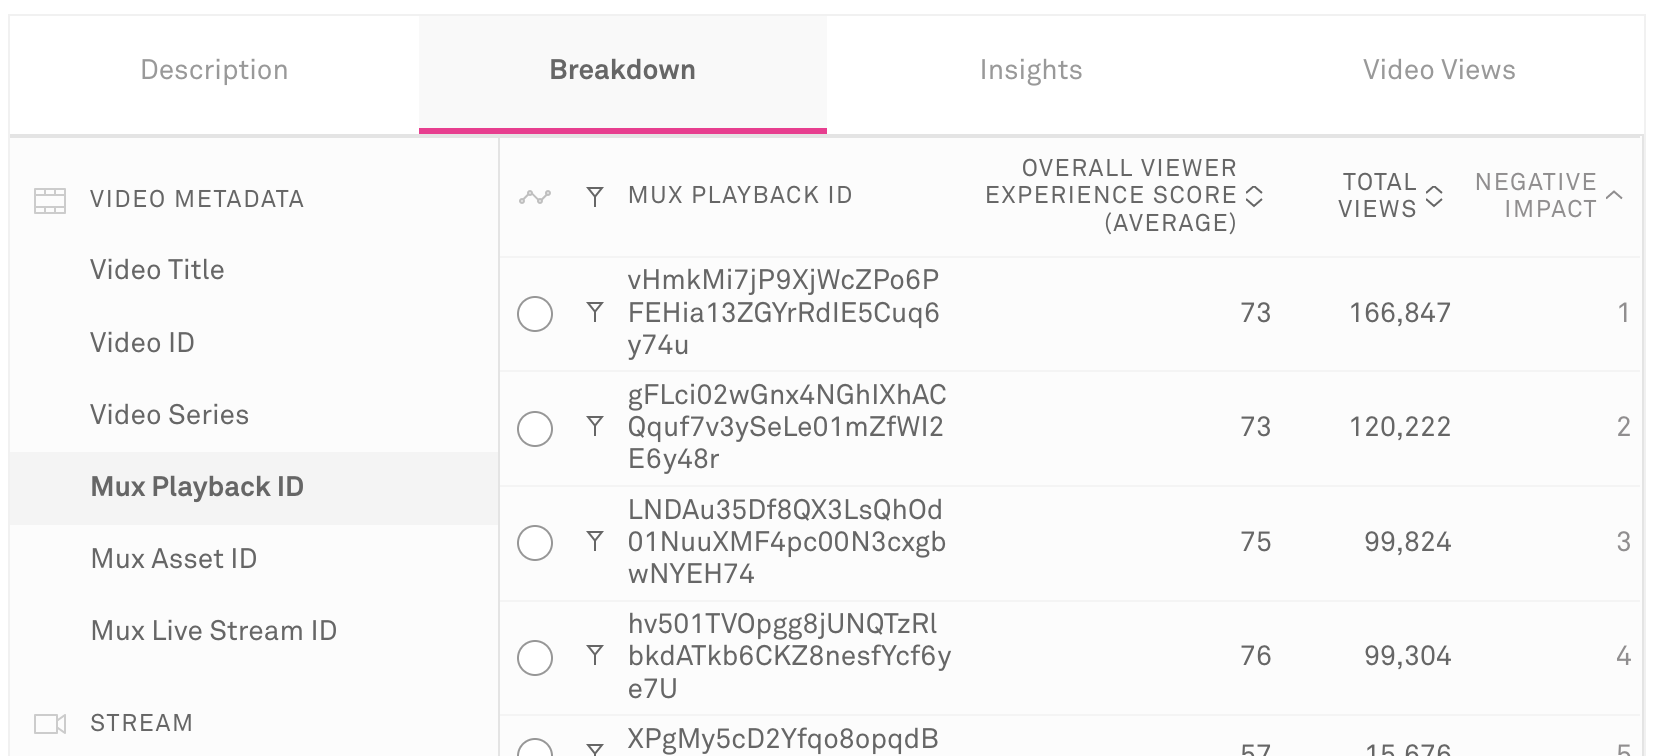
You can also filter by a specific stream or playback ID.
Accessing an asset or live stream from Video Data in View Detail
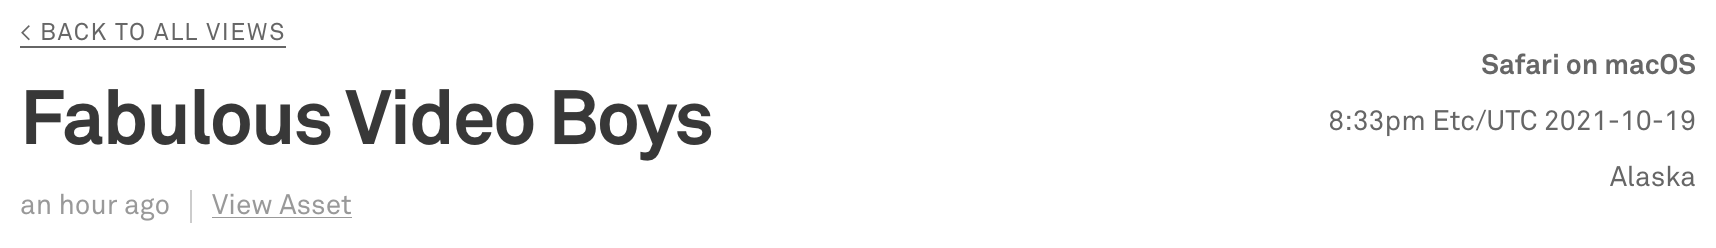
The View Detail page allows you to inspect a specific video view and the timeline of events during the playback. All of the metadata collected about the view is shown on that page and can be used to easily filter to views with similar metadata.
The asset or live stream in Video that was used to generate the view can now be accessed directly from the top of the View page using the "View Asset" or "View Live Stream" link under the title:
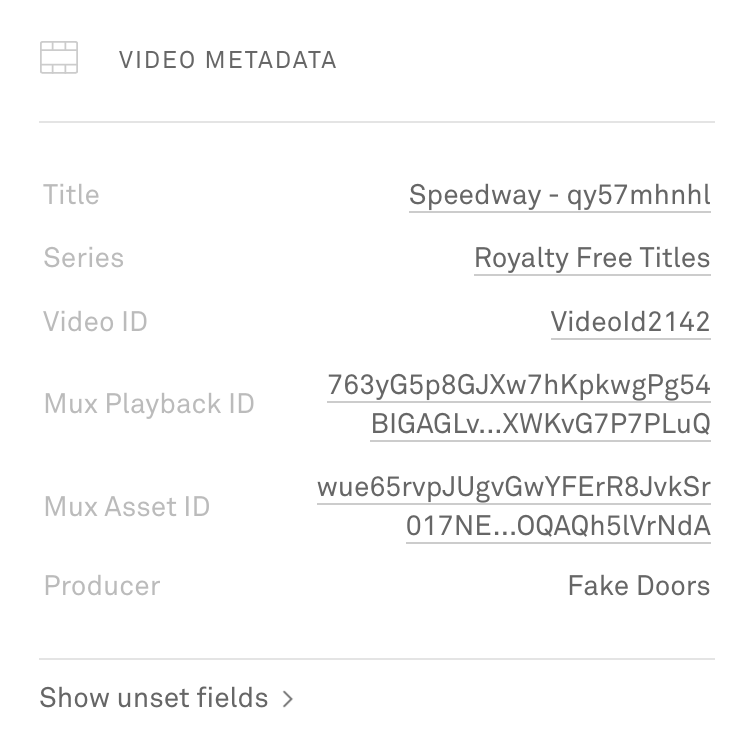
IDs from Video are also populated automatically in the Video Metadata detail section and you can filter to views with the same ID by clicking the link value.
Accessing Video data from Video Asset and Live Stream detail pages
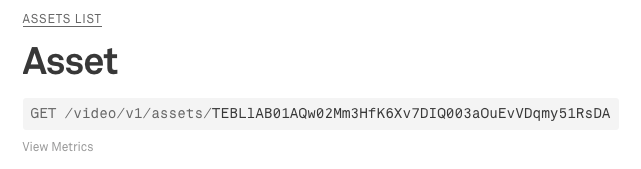
When on the Asset and Live Stream pages, it is often helpful to be able to jump directly to the historical reporting for an asset in order to see how many views the stream has generated or how viewers have experienced the stream.
Developers can now access the metrics for an asset or live stream from the Asset or Live Stream page using the "View Metrics" link under the Asset/Live Stream url at the top of the page.
These updates make it easier and more valuable to use Data and Video together. We're always listening and making updates based on your feedback, so please let us know what you're building, and how we can help!