Updated 08/28/25: Dashboard favoriting and PDF export are now available for Custom Dashboards, enabling quick access to frequently used views and offline sharing. Learn more in the guide.
You deploy a new player version on Monday. By Wednesday, you need to know: is rebuffering better or worse in Germany compared to last week? You head to Mux Data, apply filters for country, time range, and player version. Thursday morning, you need the same view but for startup time instead of rebuffering. You rebuild the filters. Friday, your manager asks for both metrics side-by-side. You rebuild again.
Sound familiar? We've heard this workflow from developers constantly — you have the data you need, but getting to it requires rebuilding the same filtered views over and over. What if you could save those specific combinations and return to them instantly?
Today we're launching Custom Dashboards in Mux Data — a way to save persistent, multi-metric dashboard views that remember exactly what you care about.
What's New: Your data, your view, your story
Mux already gives you deep insights into video quality metrics like startup time, rebuffering, and engagement. What's new is the ability to combine multiple metrics into a single, personalized dashboard view that persists across sessions.
Until now, you could access any data you needed in the Mux Data UI but it often meant rebuilding the same filtered views, switching between tabs, or mentally combining insights from multiple dashboards. With Custom Dashboards, you can collect meaningful, use-case-specific metrics in a single dashboard and return to the exact same view anytime.
Build once, use daily
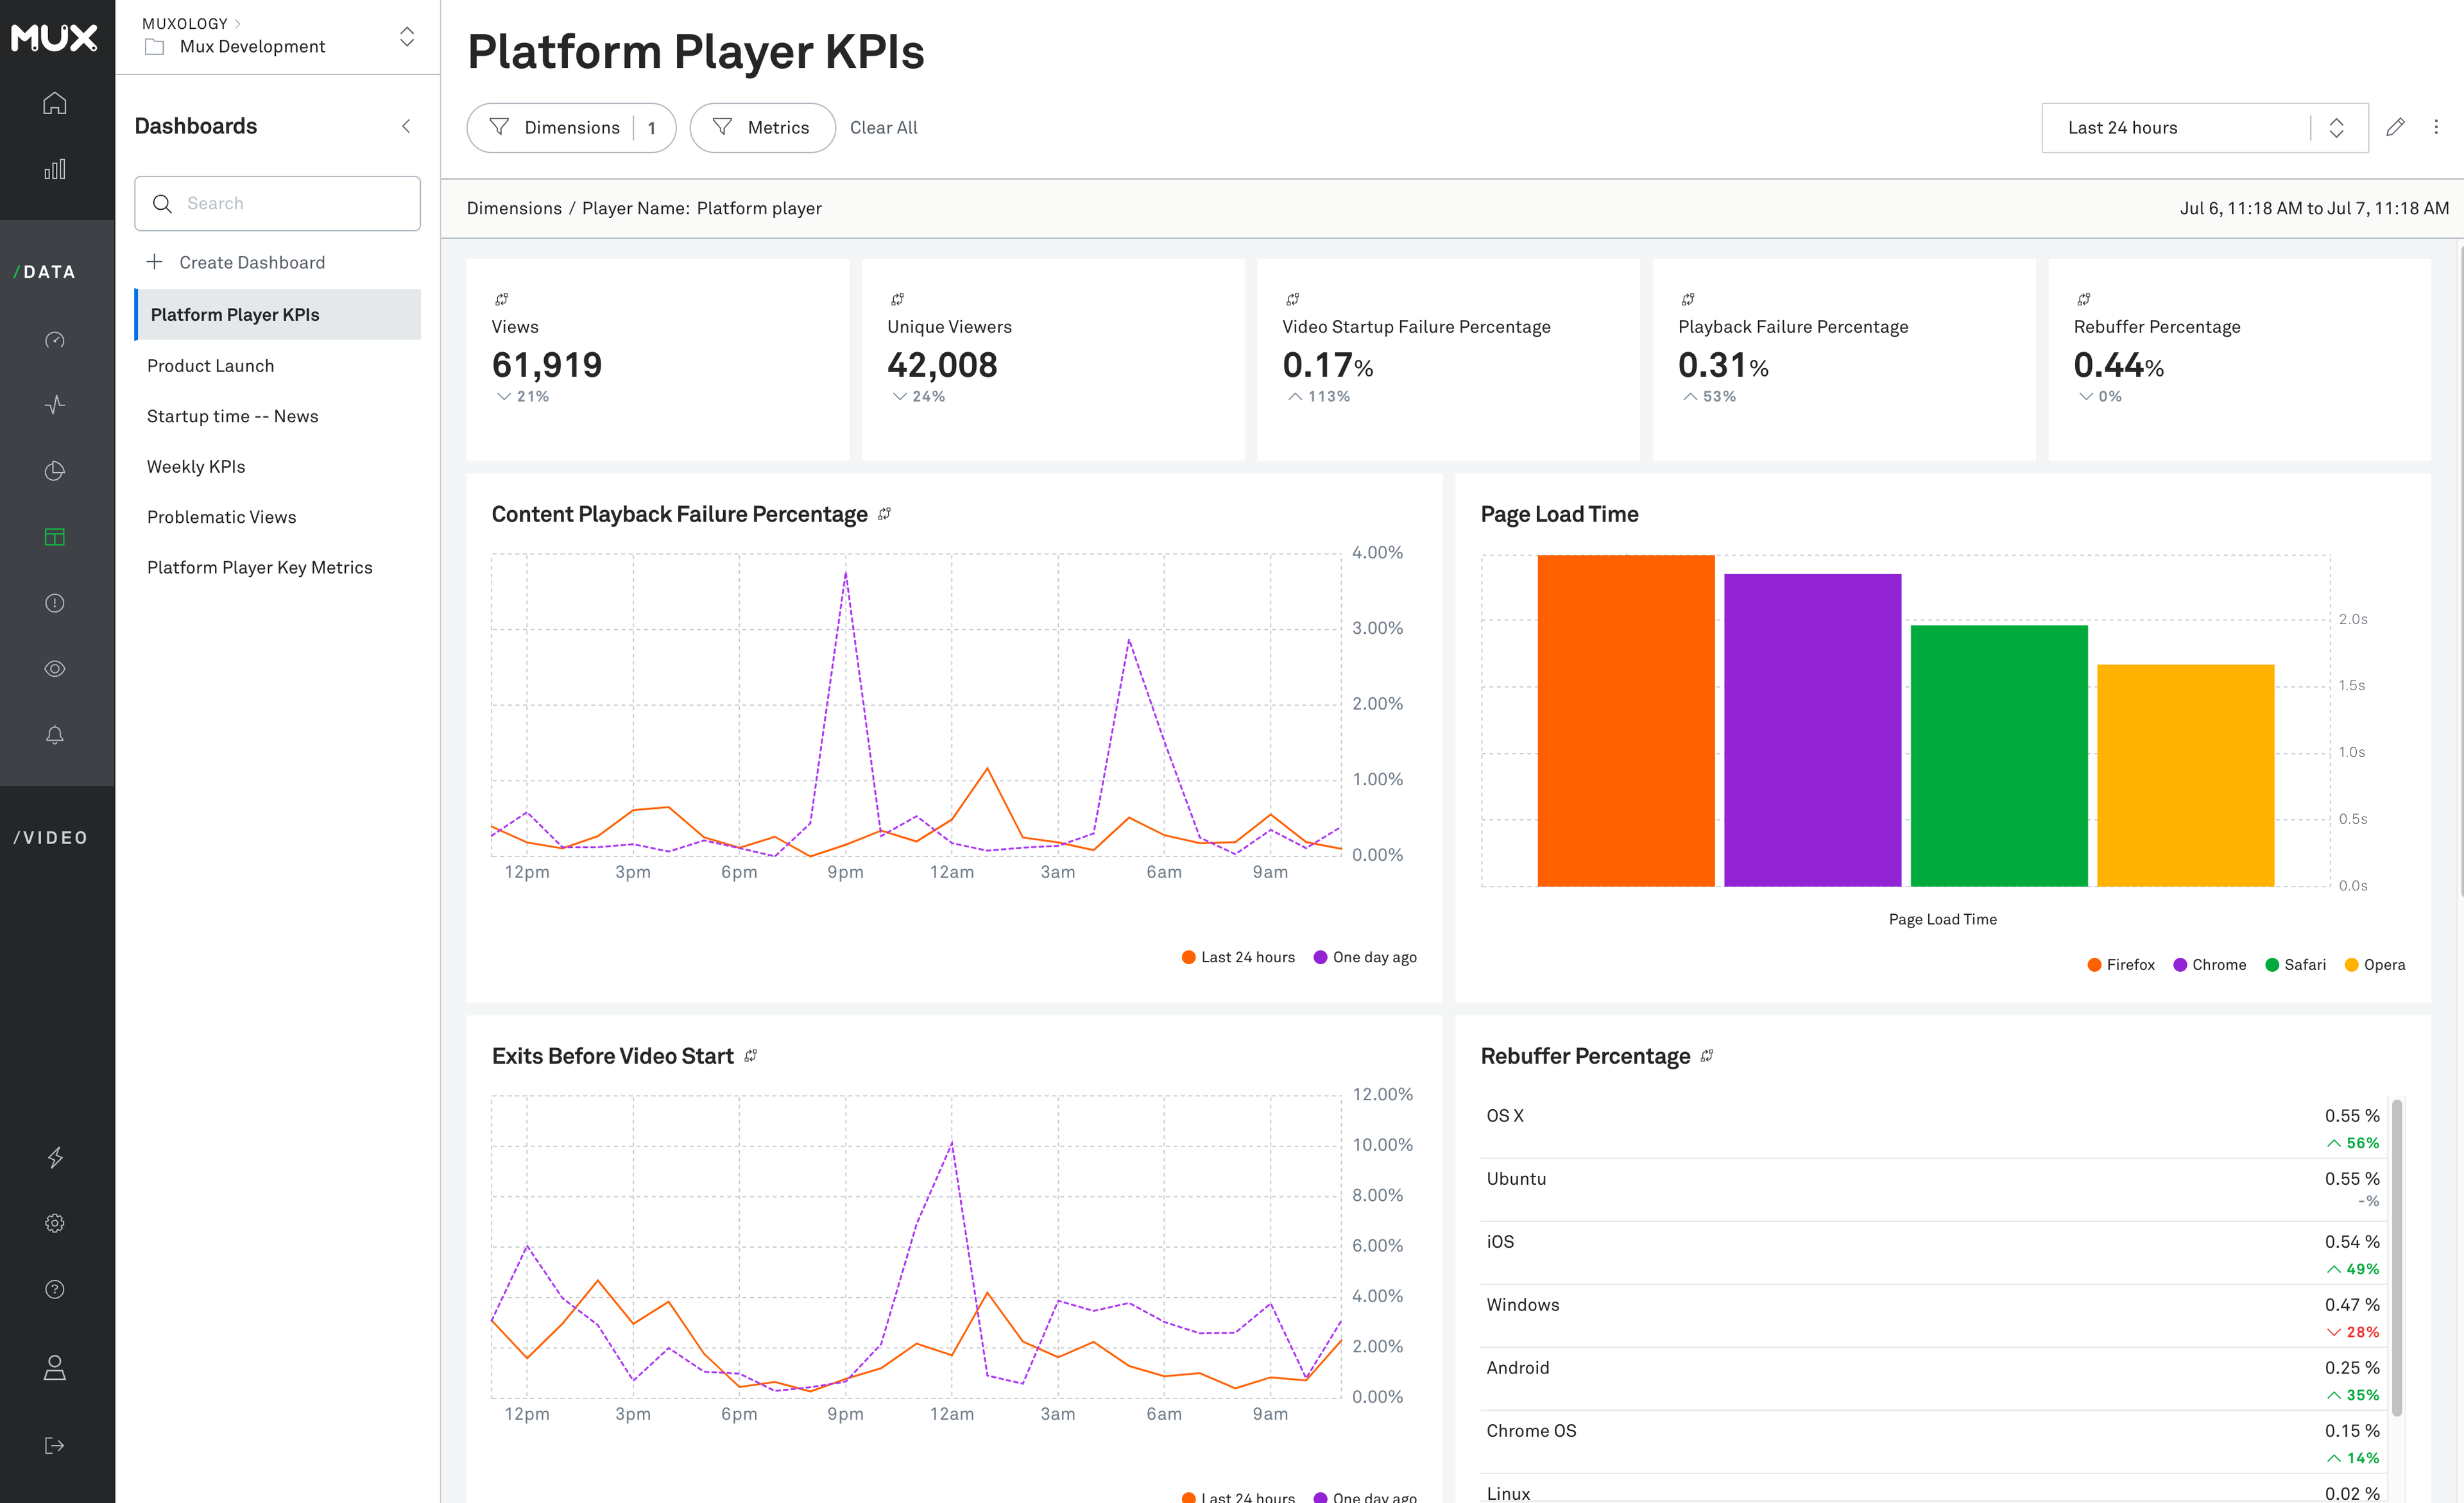
Each custom dashboard supports 10 components, using four visualization types:
- Timeseries charts: Spot trends and changes over time, like tracking experience score improvements after a deployment
- Bar charts: Compare performance across dimensions like geography, device, or player version
- Lists: Rank key metrics or entities (e.g., top video titles by rebuffering rate)
- Metric numbers: Surface high-level KPIs at a glance — the kind of summary stats you need for executive updates or quick health checks
Once built and saved, your custom dashboard becomes part of your Mux workflow. Save them and return anytime to the exact configuration you need — no re-filtering, no rebuilding, no starting from scratch.
Flexible filtering at every level
Custom Dashboards inherit all of Mux Data’s rich filtering capabilities with new flexibility:
Dashboard-level filters: Apply global filters that affect every component allowing you to focus an entire dashboard on a specific time period, geography, or custom dimension.
Component-level filters: Apply unique filters to individual components for side-by-side comparisons. For example, compare startup times between player_version = "2.1" and player_version = "2.0" in the same dashboard.
Metric-based filters: Include only data that meets specific criteria, like rebuffering_percentage > 5% AND country = 'Germany' to isolate quality issues in specific markets.
Create dashboards that tell nuanced, tailored stories. Track rebuffering improvements across countries, compare engagement between player versions, or monitor the performance impact of a new CDN — all in a single, focused view.
Coming soon: Collaboration and sharing
Custom Dashboards work with all existing Mux Data metrics. Build charts and filter by the dimensions you need and all dashboard configurations are saved to your account for instant access.
Share dashboard links directly with anyone with access to your account and they can easily duplicate and save their own versions.
Keep an eye on the changelog. In the next few weeks you’ll be able to
- Make dashboards private for your own use or public to allow teammates to find your dashboards within the Mux UI.
- Organize dashboards into collections for team-wide alignment and easy discovery
Start building your data story today
Custom Dashboards are available now for accounts on Self-Service Media and Custom Media plans. Your existing saved views and bookmarks will continue to work exactly as before — Custom Dashboards are additive to your current workflow.
Ready to try it? Check out this guide and build your first custom view.