Build a custom dashboard
Create custom dashboards in Mux Data to visualize and track the metrics that matter most to your video performance. Custom dashboards allow you to combine multiple metrics, apply filters, and organize data in a way that best serves your monitoring and analysis needs.
What are Custom Dashboards?
Custom dashboards provide a centralized view of your video performance data through configurable components. You can create dashboards with multiple visualization types, apply filters, and customize time periods to focus on specific aspects of your video performance. Dashboards come in two types: Metrics dashboards for historical analysis and Monitoring dashboards for near-real-time operational visibility.
Key features:
- Two dashboard types: Metrics (historical) and Monitoring (near-real-time)
- Four component types for Metrics dashboards: Timeseries, Bar charts, Lists, and Metric numbers
- Three component types for Monitoring dashboards: Monitoring Timeseries, Monitoring Heatmap, and Monitoring List
- Up to 10 components per Dashboard
- Dashboard and component-level filtering
- Flexible time period selection (Metrics only)
- Comparison intervals
- Dashboard sharing and duplication
Custom Dashboards are available on Mux Data Media plans. Learn more about Mux Data Plans or contact support.
Creating a Dashboard
To create a new custom dashboard:
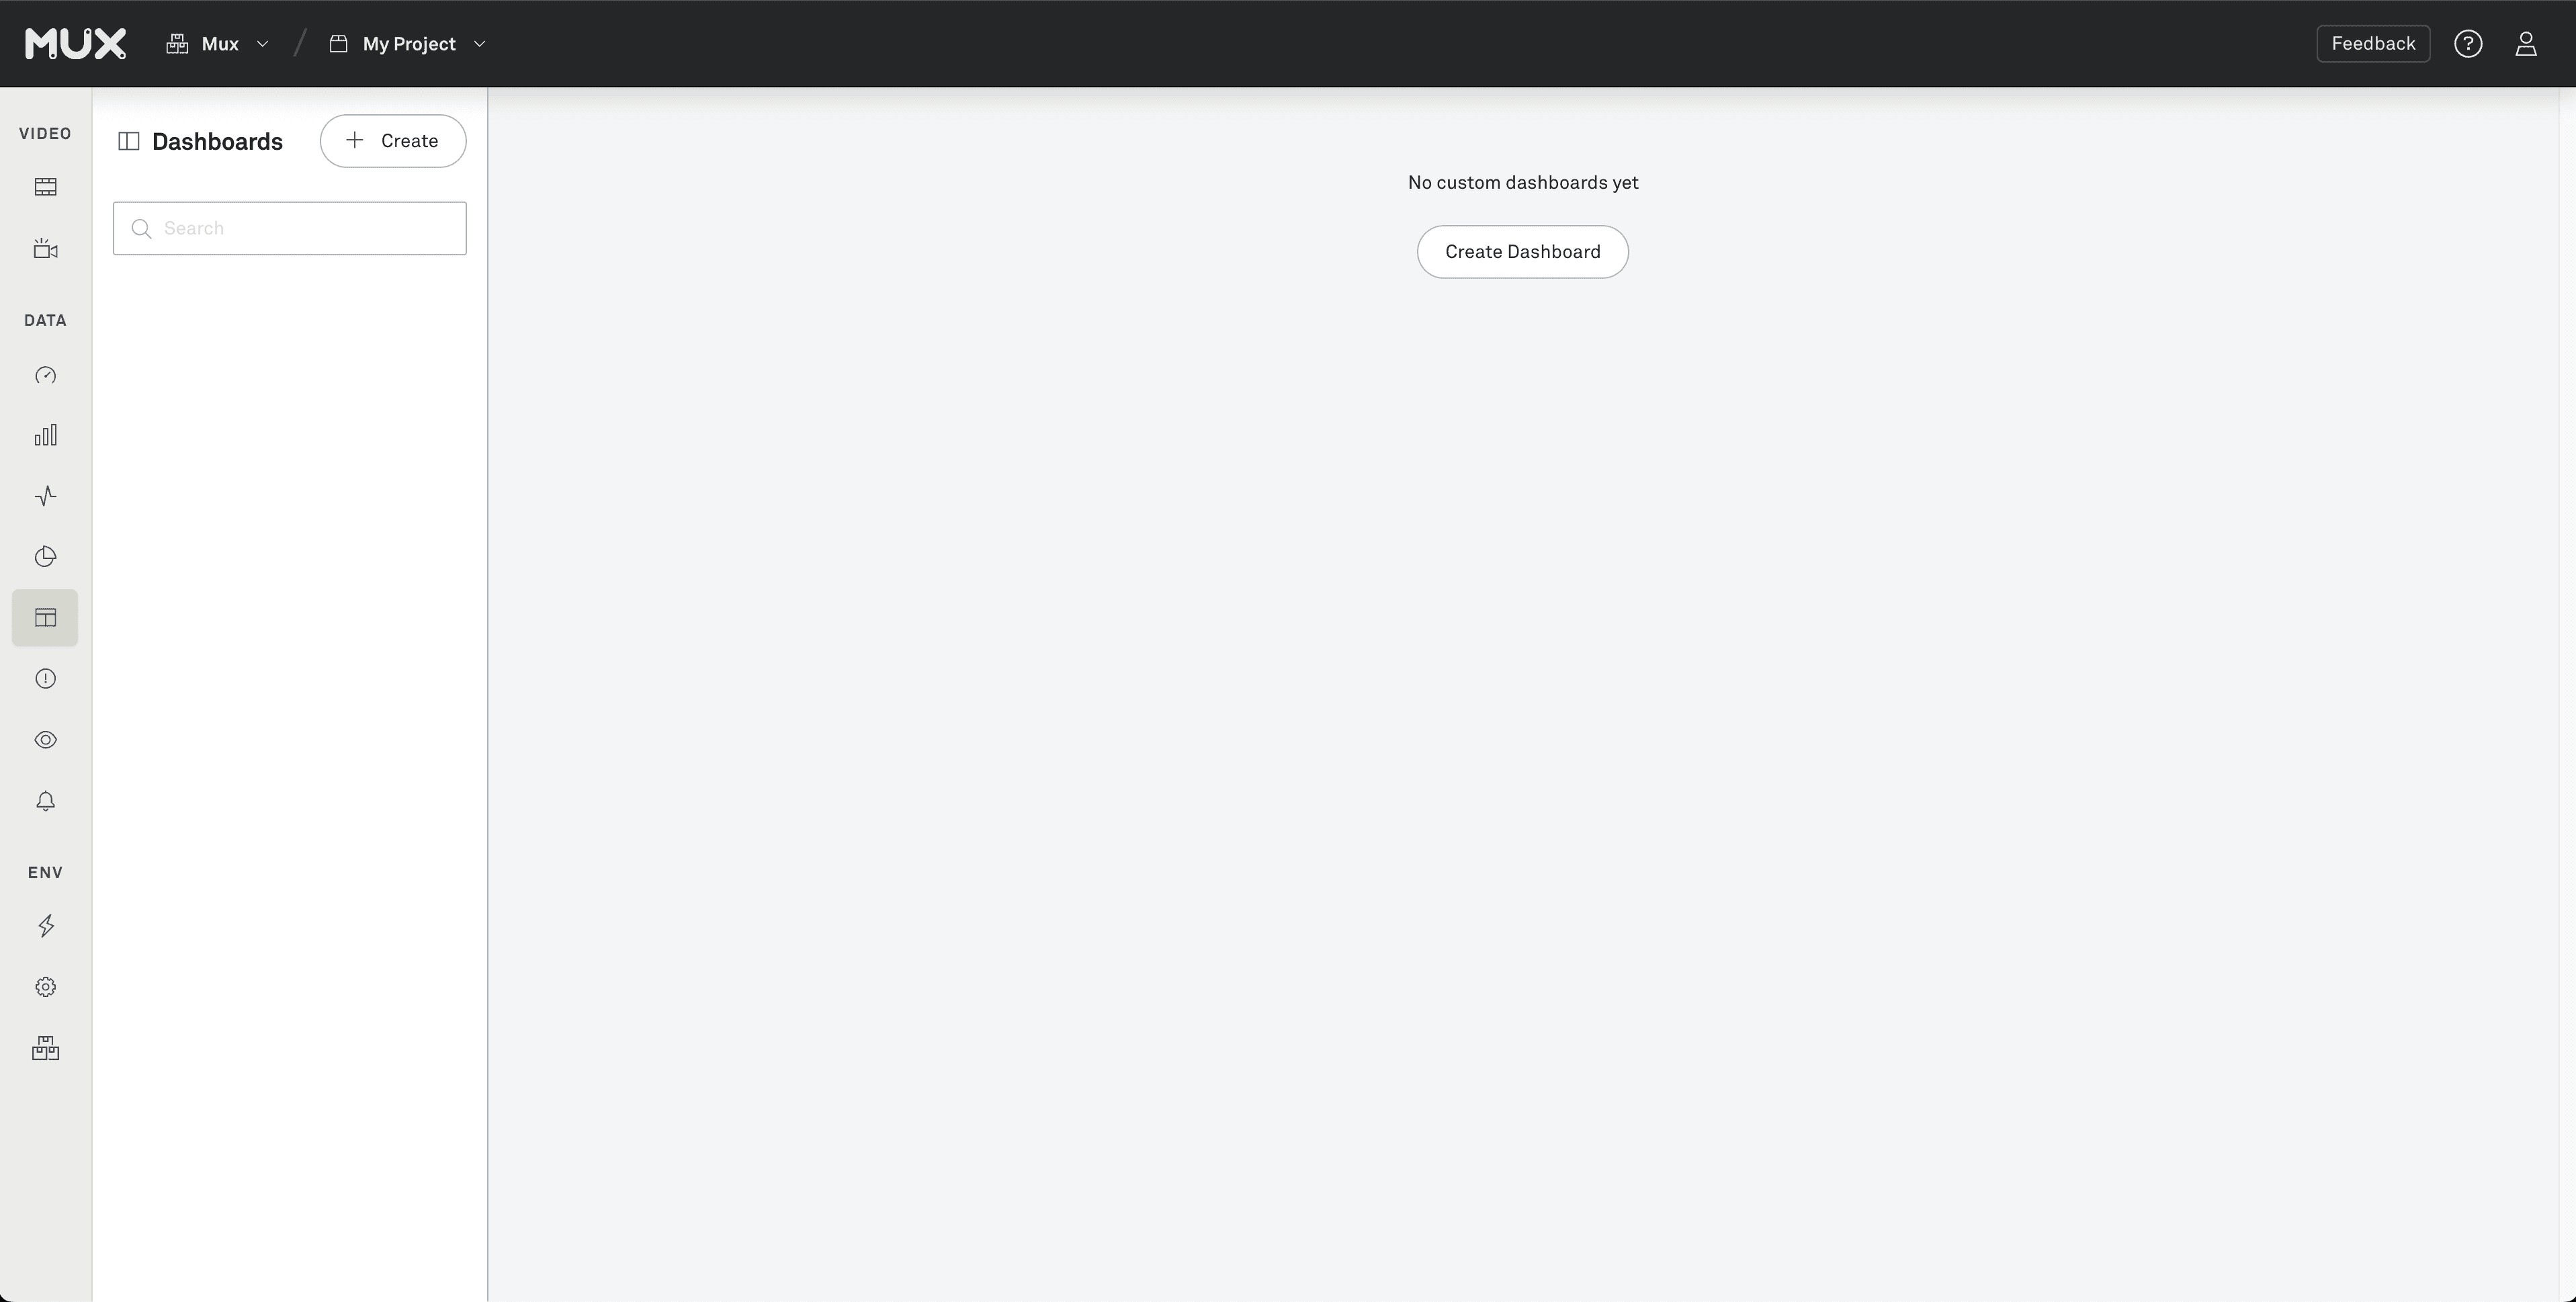
- Navigate to the Dashboards section in Mux Data
- Select Create Dashboard from the left menu or main window
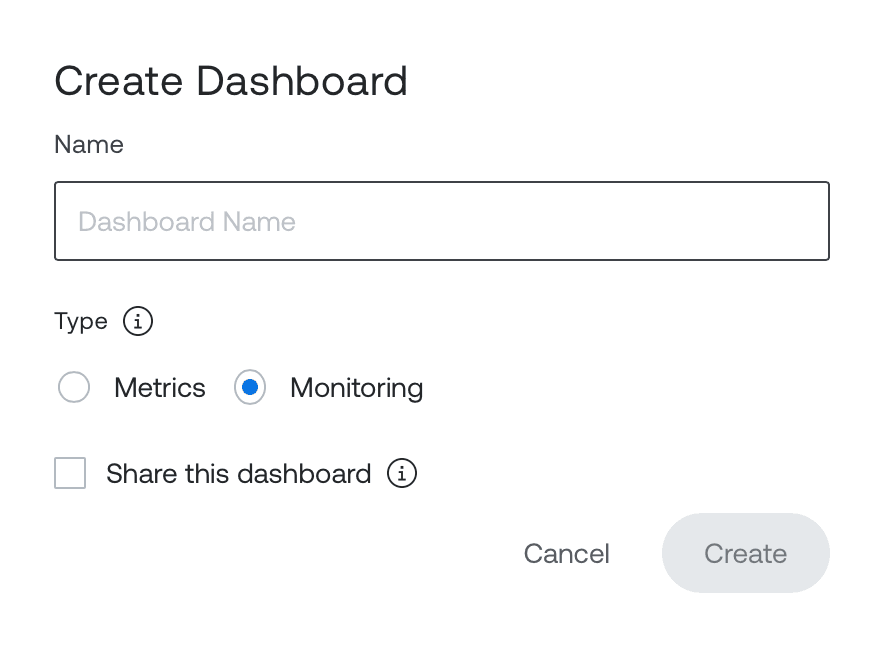
- Enter a descriptive name for your dashboard
- Select a dashboard type:
- Choose Metrics for historical analysis using standard Mux Data metrics.
- Choose Monitoring for near-real-time operational dashboards using Monitoring metrics. This option appears only if your organization has access to the Monitoring API.
- Select Create Dashboard
Your new dashboard will be created and ready for customization with components and filters.
Dashboard Configuration
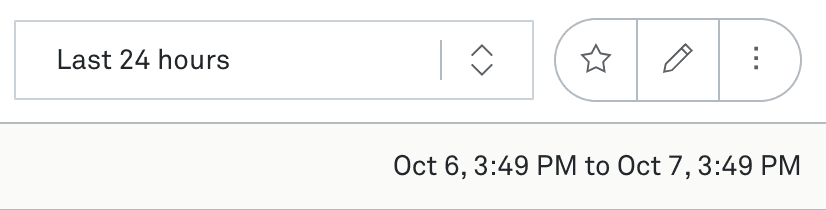
Time Periods
Configure the time period for your entire dashboard to focus on specific date/time ranges:
- Default: Last 24 hours
- Relative periods: Choose from predefined options like last 7 days or last 30 days
- Specific periods: Set exact start and end dates for consistent historical analysis
Time period changes apply to all dashboard components. Save your dashboard to preserve time period settings.
Custom Dashboards are currently only available for the standard 100 days of data. Long-term Metrics are not yet available with Custom Dashboards. Monitoring dashboards: Time period reflects the rolling window supported by the Monitoring API.
Dashboard Filters
Dashboard filters apply to all components within the dashboard providing consistent data filtering across visualizations.
Dimension Filters
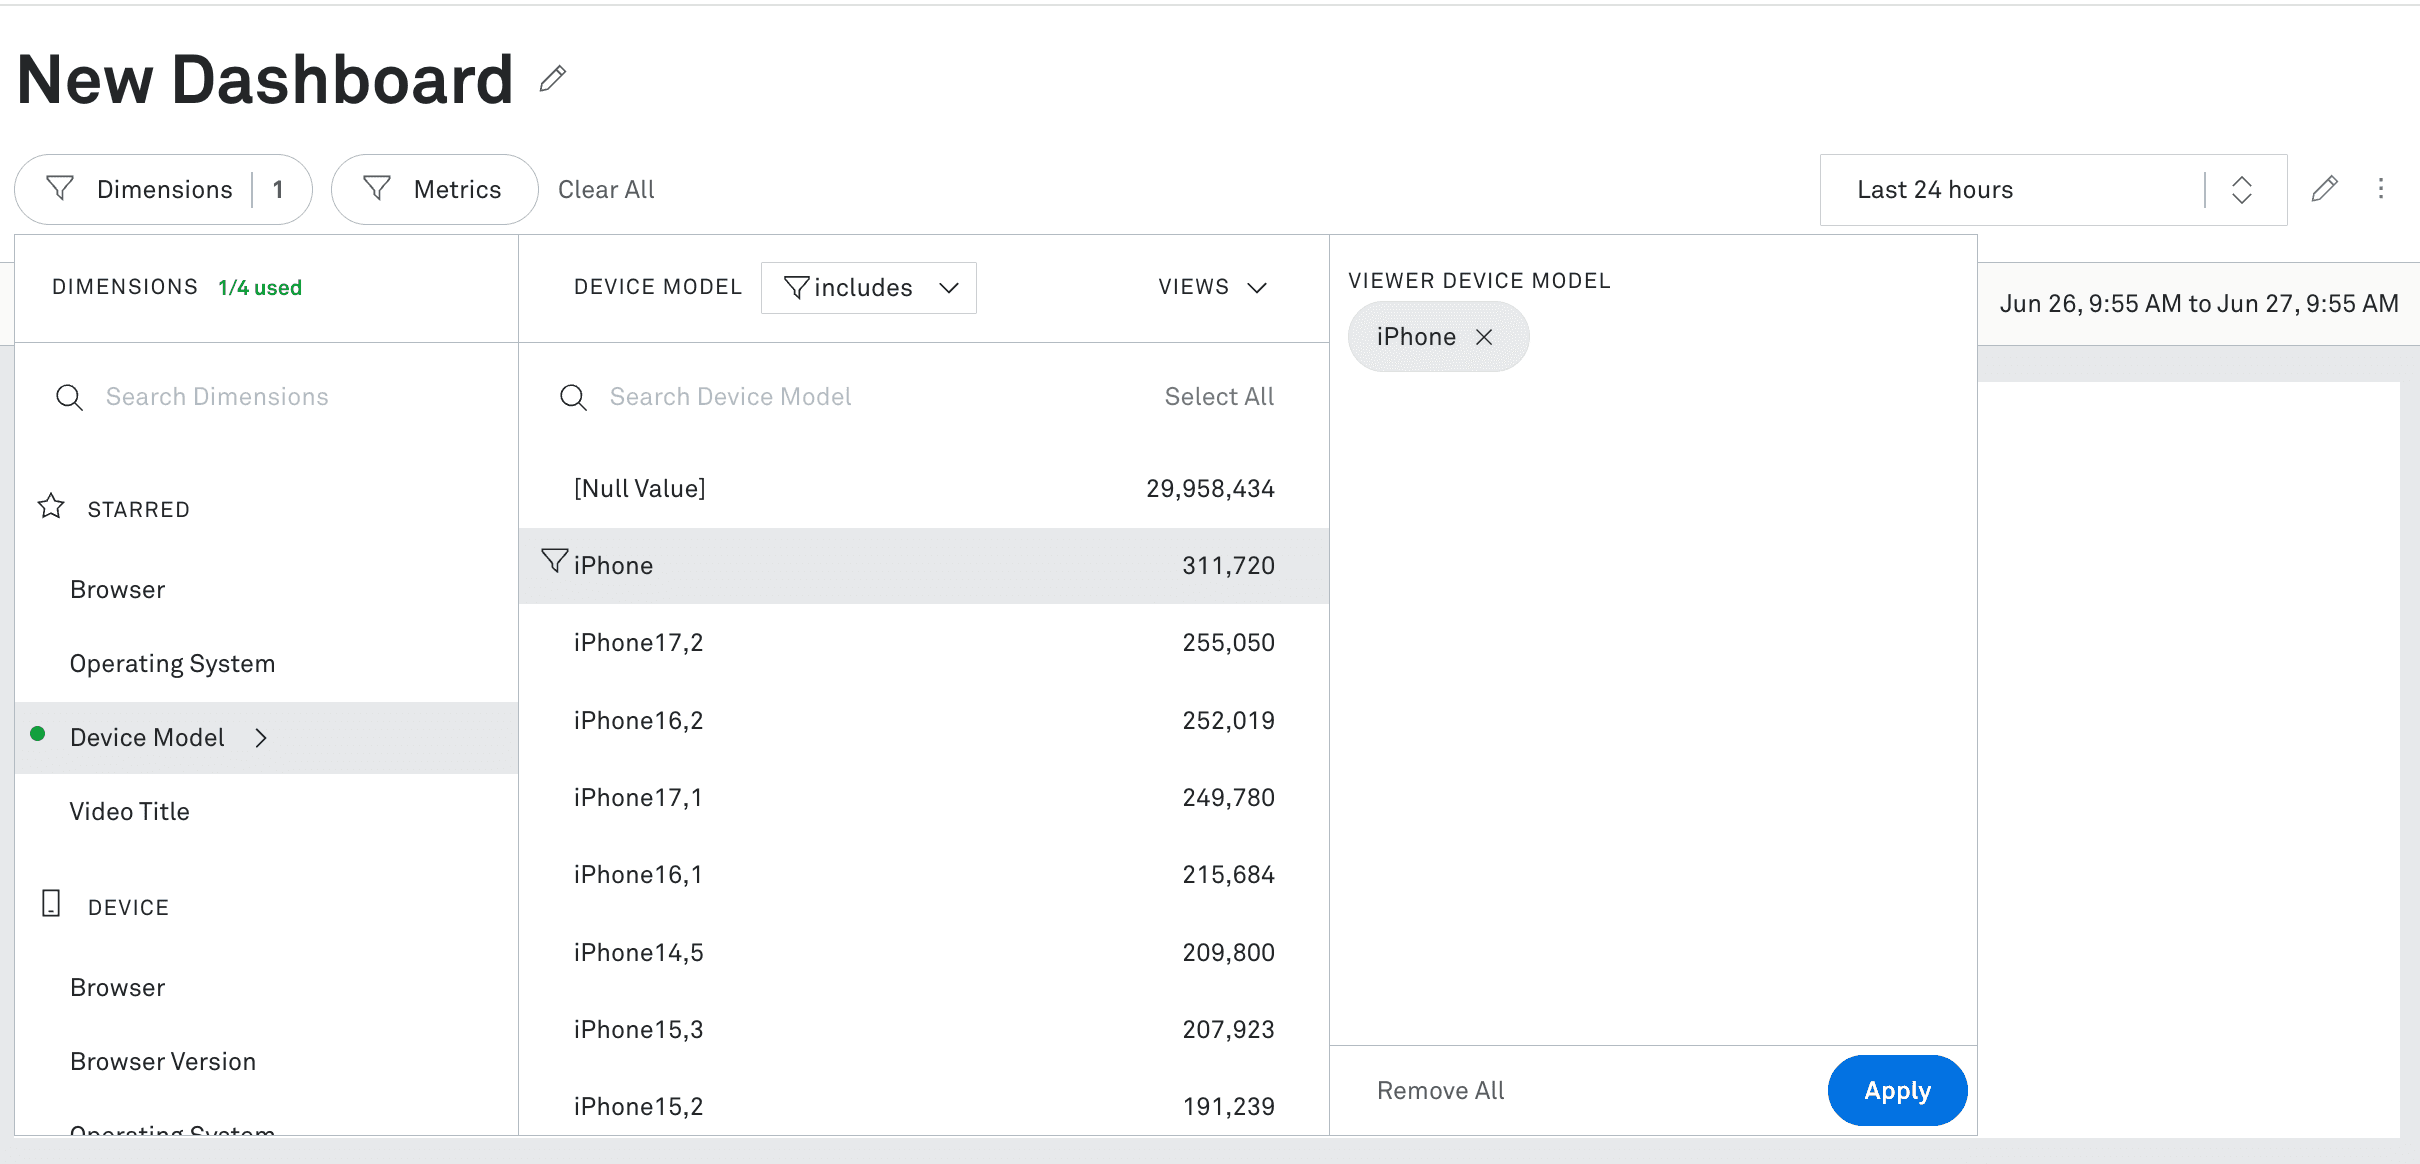
Filter by dimension values such as country, operating system, or player version:
- Select the Filter Dimensions button
- Search for and select the dimension type
- Choose specific values to include or exclude
- Multiple values use OR logic (e.g., selecting iOS and Android shows views from either platform)
For Monitoring dashboards, only Monitoring Dimensions are available as filter options.
Metric Filters
(Metrics dashboards only)
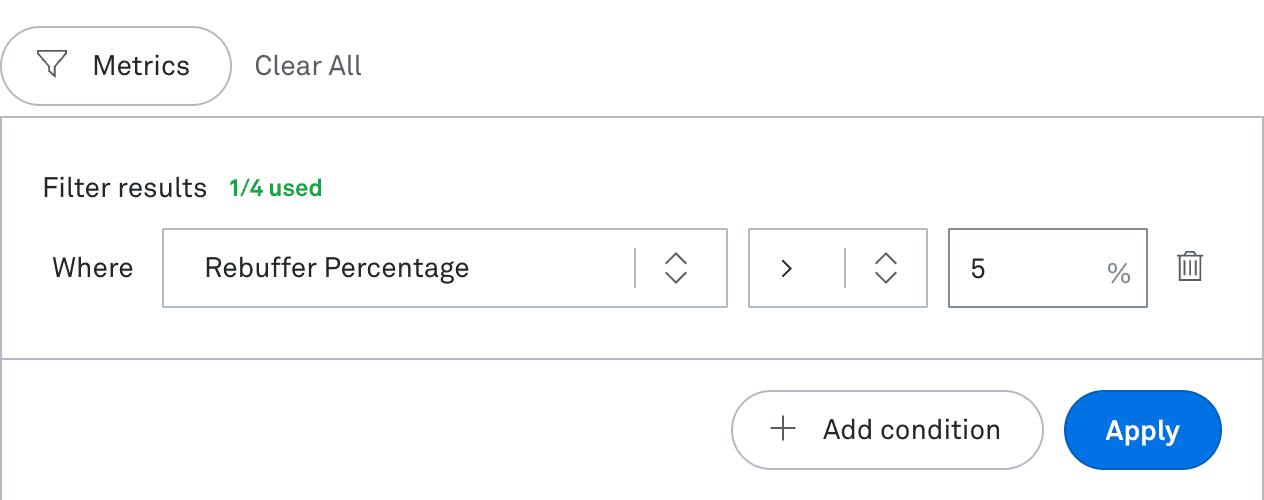
Filter by metric values to focus on specific performance thresholds:
- Select the Filter Metrics button
- Choose a metric (e.g., rebuffer percentage)
- Select an operator (≤, ≥, =, etc.)
- Set the value threshold
Filter changes can be previewed without saving. Click Save at the bottom of the dashboard to apply filters permanently.
Saved Filter Sets
You can apply a saved filter set to a Monitoring custom dashboard directly from the filter menu. Saved filter sets created in the Metrics context are not compatible with Monitoring dashboards.
Component Filters
(Metrics dashboards only)
Metric components can have their own filters in addition to Dashboard filters. Dashboard filters act as parent filters affecting all components. Component level filters are additive to Dashboard filters but only apply to the component.
If dashboard and component filters conflict, the component may show no data. Ensure filter combinations are logical and compatible.
Dashboard Components
Components visualize individual metrics within your dashboard. Each component type serves different analytical purposes and can be customized with specific filters and options.
- To add a Dashboard component to a new Dashboard, select the Create Component button.
- To add a Dashboard component to an existing Dashboard, select the Edit Icon next to the date selector.
Metric Dashboard Components
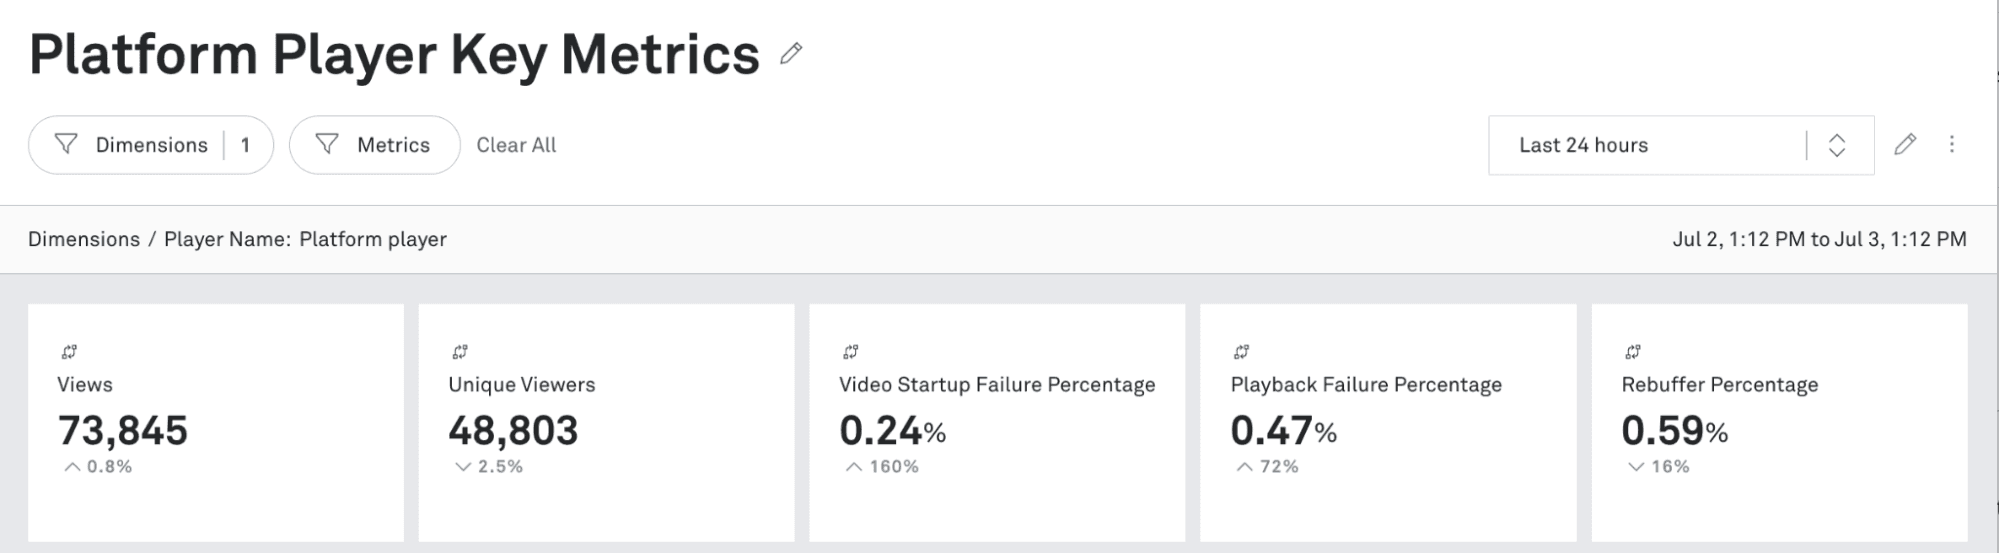
Metric Numbers
Display key performance indicators in a prominent metrics bar at the top of your dashboard. Up to 5 Metric numbers can be added per dashboard. Metric numbers (up to 5) collectively count as 1 component.
Configuration:
- Select Metric Number as the component type
- Choose the metric to display
- Provide a descriptive name (50 character limit)
- Optional: Add a comparison time period to show rate of change
- Optional: Apply component-specific dimension or metric filters
Metric number components appear in creation order and cannot be reordered.
Timeseries
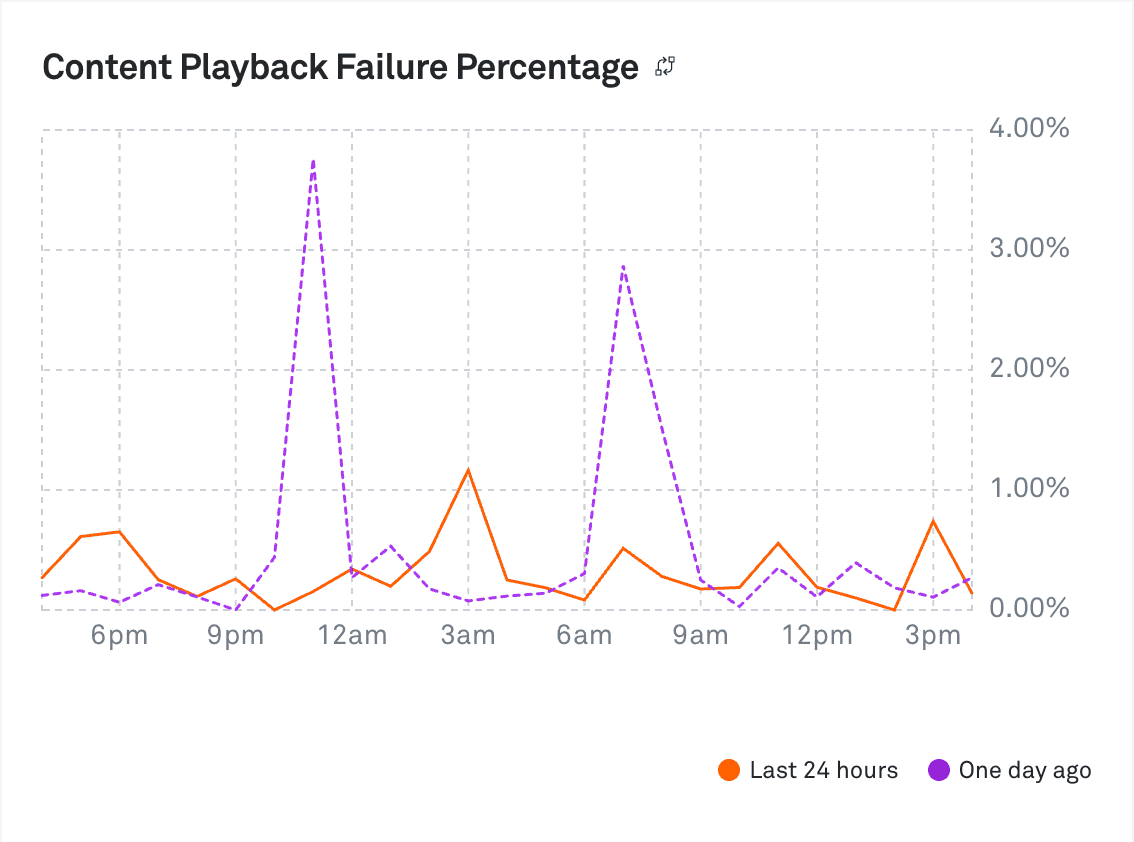
Track metrics over time to identify trends, patterns, and anomalies in your video performance.
Configuration:
- Select Timeseries as the component type
- Choose the metric to chart over time
- Set a descriptive component name
- Select component size (half or full width)
- Optional: Choose either:
- Comparison interval: Compare current period with a previous timeframe
- Breakdown values: Chart multiple values for a single dimension type (e.g., different device types)
- Optional: Apply component-specific filters
Comparison intervals and breakdown values are mutually exclusive options. Also note that breakdown dimensions will take priority over dashboard and component filters of the same dimension.
Bars
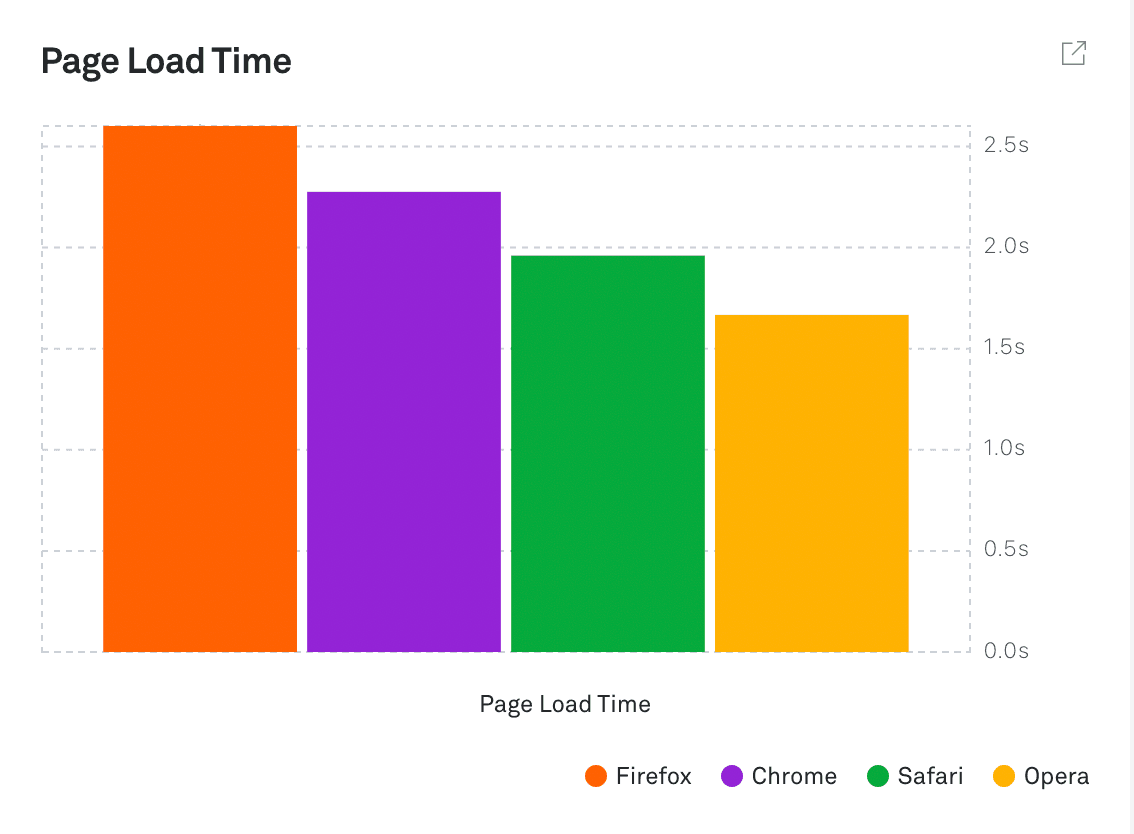
Compare performance across different dimension values using horizontal bars.
Configuration:
- Select Bars as the component type
- Choose the metric to measure in the bars visualization
- Select component size (half or full width)
- Choose breakdown dimension type and values that you wish to display
- Optional: Add a comparison interval to compare current period with a previous timeframe
- Optional: Apply component-specific filters
Breakdown values must come from a single dimension category.
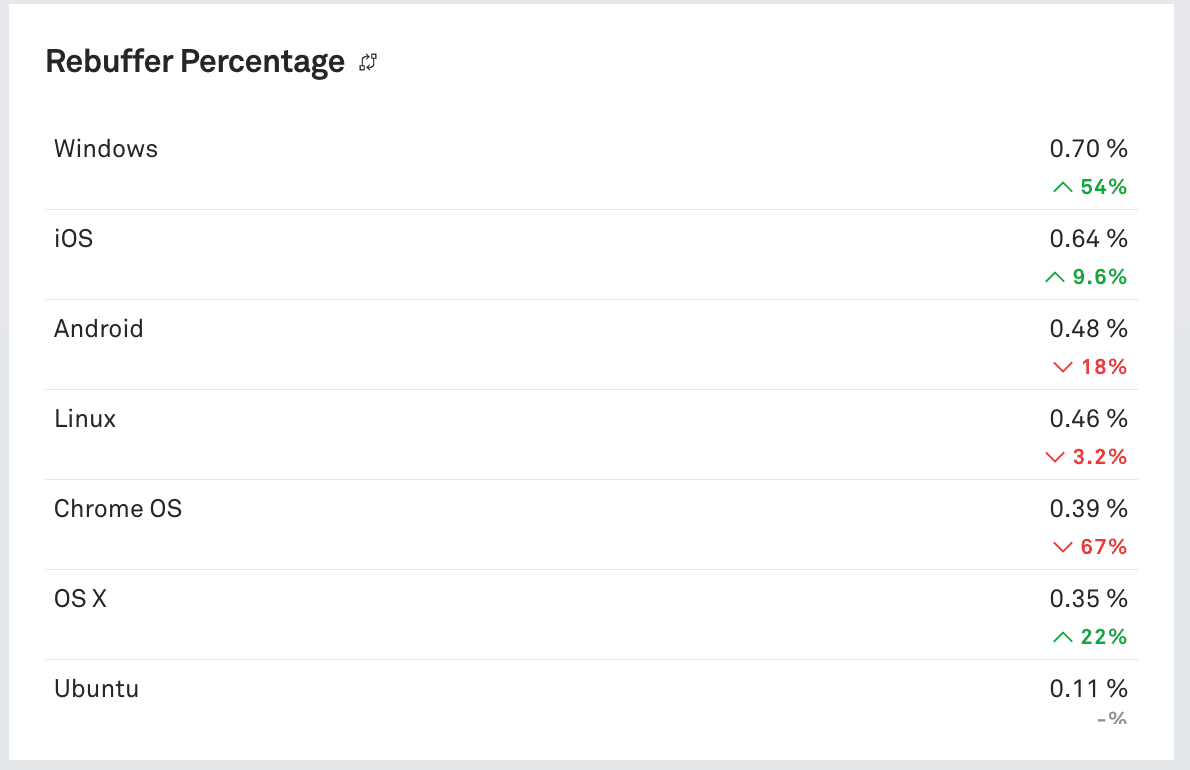
List
Rank and organize data to quickly identify top performers or problem areas.
Configuration:
- Select List as the component type
- Choose the metric to measure for each list item
- Select the dimension to list (e.g., player names, video titles)
- Set sort order (ascending or descending)
- Specify the number of items to display in the list component
- Provide a descriptive component name
- Optional: Add a comparison interval
- Optional: Apply component-specific filters
Lists are only available in half-width size.
Exploring Metric Details
Access deeper analysis directly from any Metrics dashboard component:
- Select the Go To Metrics icon on any component.
- The metrics page opens with the component's selected filters and metric pre-populated.
This deep-link navigation is available for Metrics dashboard components only. Monitoring components link to the associated Monitoring breakdown with filtering preserved.
Monitoring Dashboard Components
Monitoring dashboards support three dedicated component types that use near-real-time Monitoring data. These components are only available in dashboards created with the Monitoring type.
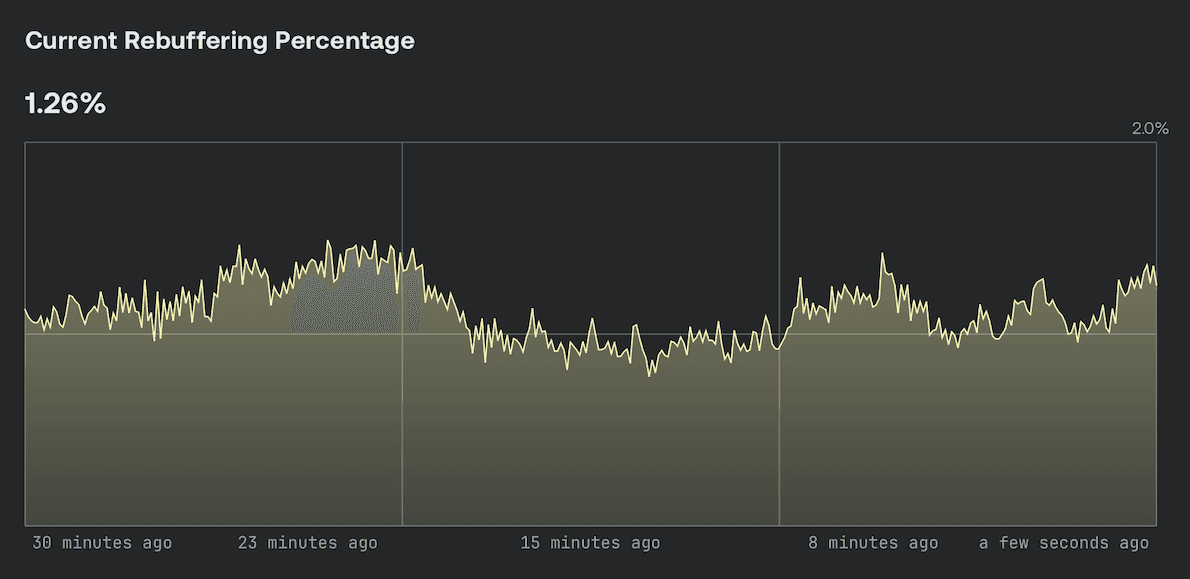
Monitoring Timeseries
Track near-real-time monitoring metrics over a rolling time window to detect live issues and trends in viewer experience.
Available metrics:
- Current Concurrent Viewers (CCV)
- Video Startup Failures by Startup Attempts
- Playback Failures by CCV
- Exits Before Video Start by Start Attempts
- Current Rebuffering Percentage
- Current Average Bitrate
Configuration:
- Select Monitoring Timeseries as the component type.
- Choose the monitoring metric to track.
- Set a descriptive component name.
- Select component size (half or full width).
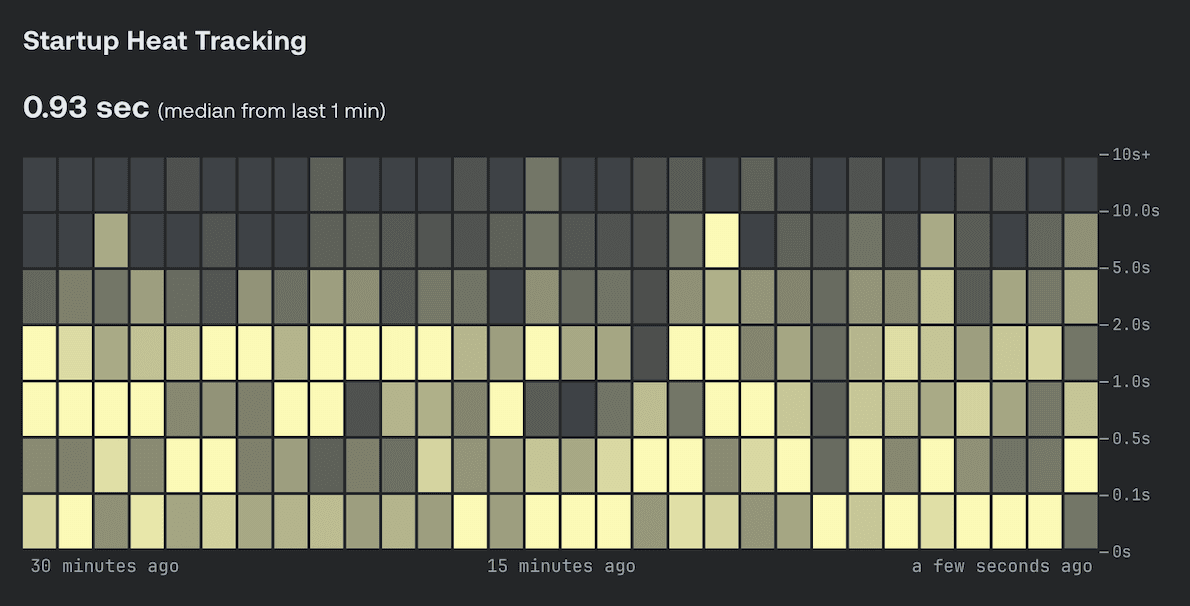
Monitoring Heatmap
Visualize the Video Startup Time monitoring metric to track impact on your viewers in real time.
Configuration:
- Select Monitoring Heatmap as the component type.
- Set a descriptive component name.
- Select component size (half or full width).
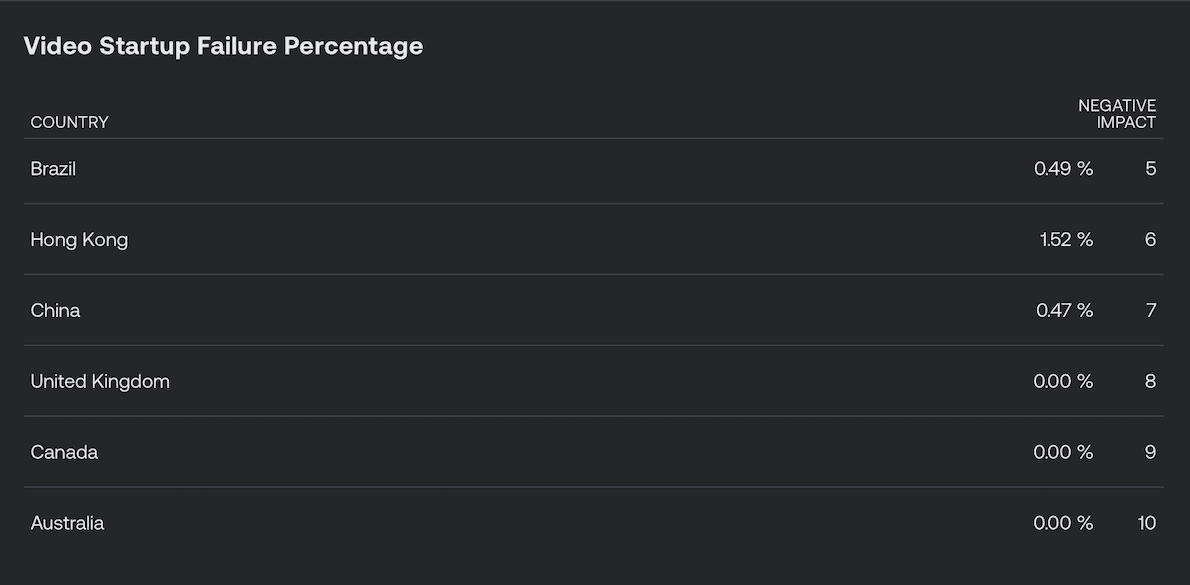
Monitoring List
Rank dimension values by a monitoring metric to surface the segments with the highest impact on your viewers in real time.
Available metrics: Same as Monitoring Timeseries (see above).
Configuration:
- Select Monitoring List as the component type.
- Choose the monitoring metric to measure.
- Select a breakdown dimension from the Monitoring Dimensions.
- Choose the number of values to display: up to 20, in increments of 5.
- Set a descriptive component name.
Each row in the list displays the metric value, the current concurrent viewer count (CCV), and a negative impact score to help you prioritize issues.
Dashboard Management
Dashboard Visibility and Sharing
When you create a dashboard it is private by default — only you can see it. You can change a dashboard's visibility at any time using the More Options menu (⋯).
| Visibility | Who can see it |
|---|---|
| Private | Only you (the owner) |
| Public | All users in your Mux environment |
All users can view public dashboards. To save an editable version of a public dashboard, create a duplicate (see Duplicating Dashboards).
Sharing via Dashboard Link
Any dashboard can be shared with users who have access to your Mux environment via the dashboard link, even if it's not marked as public. Users who receive a link can:
- View the dashboard
- Favorite it to save it to their personal list
- Create a duplicate to make their own editable copy (see below)
Editing Dashboard Permissions
Users have the ability to edit dashboards they are the owner of but do not have the ability to edit public dashboards they do not own. Admins have full editing abilities for all dashboards.
Advanced role-based permissions are coming soon.
Favoriting Dashboards
Favorite personal or shared dashboards to allow quick access to your most frequently used dashboards. You can have up to 20 favorited dashboards across your environments.
Favorite a dashboard by pressing the favoriting star in the dashboard menu. When a dashboard is favorited, the star will be highlighted and the dashboard will be added to the top of the custom dashboard navigation sidebar in the favorites section.
Dashboard Navigation
Your dashboards are organized into two sections in the sidebar:
- My Dashboards — Dashboards you own that have no additional sharing permissions (private status).
- Shared — Dashboards you own that you have shared with other users or made public.
A Starred section at the top of the sidebar surfaces your most-accessed dashboards across both categories.
Saving Dashboard Copies
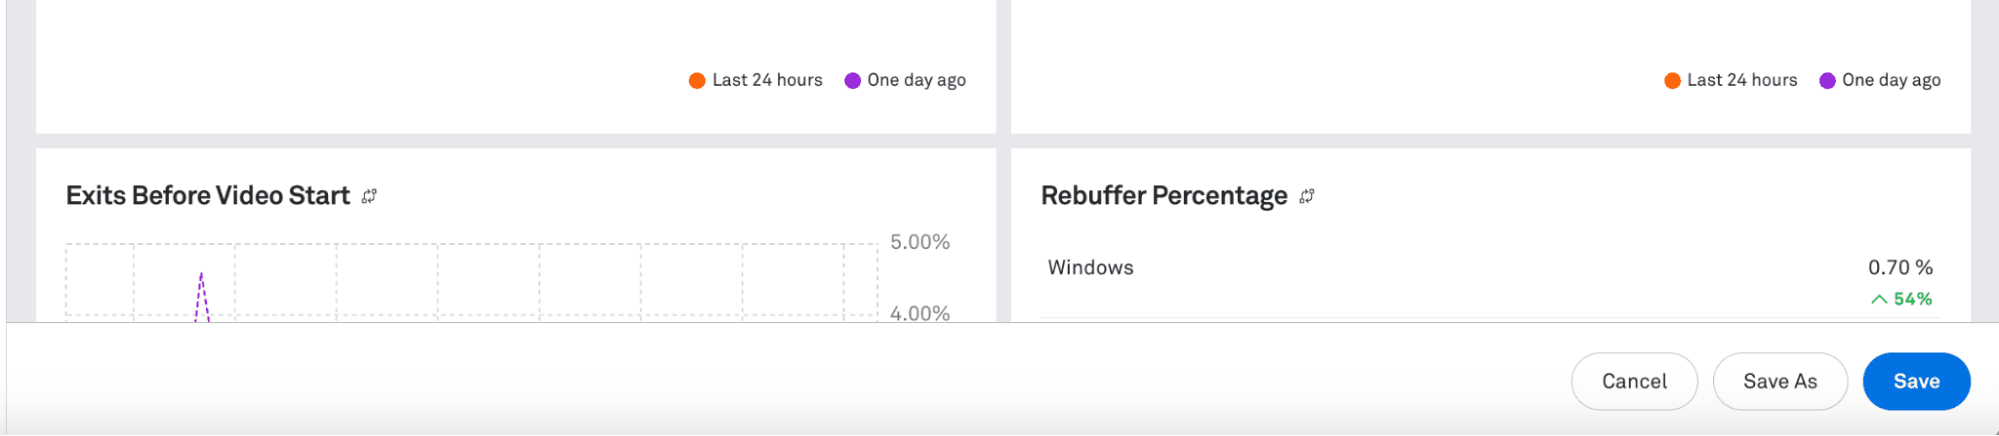
Save a modified version without affecting the original:
- Make your desired changes to the dashboard
- Use the Save As option in the save menu
- Provide a new name for the copy
Exporting Dashboards
Export a dashboard to a PDF to save a snapshot of your dashboard:
- Select the More Options menu (⋯) next to the favorite button
- Choose Export PDF
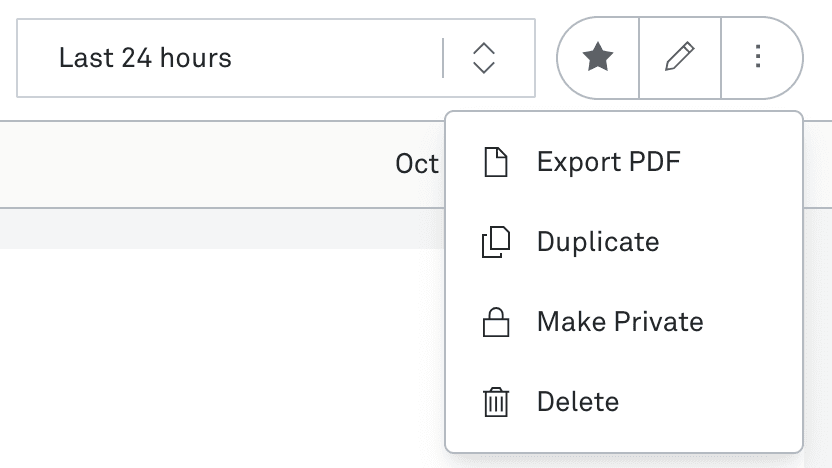
Duplicating Dashboards
Create an exact copy of an existing dashboard:
- Select the More Options menu (⋯) next to the favorite button
- Choose Duplicate
Duplication is not available while a dashboard is being edited.
Deleting Dashboards
Permanently remove dashboards you no longer need:
- Select the More Options menu (⋯) next to the favorite button
- Choose Delete
- Confirm the deletion
Deleting a dashboard removes it for all users. Duplicate dashboards are not affected.