

One of Mux Video’s most distinguishing features is the ability to Just-In-Time transcode video segments (and thumbnails, storyboards, etc.) during playback. It’s key to our goal of making any uploaded content viewable as quickly as possible, and our customers rely on it to create snappy experiences for their users.
Building a video platform that can do this requires a lot of moving parts: workers handling the actual encoding, storage and replication, low-latency transmission and streaming of segments as we generate them, and CDN caching and distribution to name a few. Of course doing this at scale means doing all of the above and more in a highly distributed system, which inevitably invites our friend Murphy and his ever-present law to the party.
Let’s talk about why we’re here. Between January 8th and February 4th, roughly 0.33% of audio and video segments across all VOD assets played back during this timeframe were served in a corrupted state. The ensuing behavior likely varied between players and depended on the degree to which the segments were incomplete, but in general some viewers experienced brief audio dropouts or visual stuttering during playback. No source video data was lost and all affected assets have been fully remediated.
Nobody likes incidents, and unfortunately nobody is immune to them. We take every incident seriously but this one in particular had a combination of wide-ranging impact and duration that fell short of our standards. We've fixed the immediate causes and remediated every affected asset, but we're still investigating exactly why our systems behaved the way they did under load. We're sharing what we know now because we believe transparency matters more than having all the answers.
You should never have to worry about Mux internals if you're building on our platform, but the challenges here are interesting and provide us an opportunity to be honest about what we're doing to improve.
How Mux stores and serves video
To set the stage for what went wrong, it helps to know a bit about how our storage and transcoding systems interact.
When we encode renditions for streaming, we read the source frames from a higher-quality source file we store internally and refer to as the “mezzanine.” Segments typically get generated in parallel, so our encoders are often concurrently reading overlapping portions of the same mezzanine file.
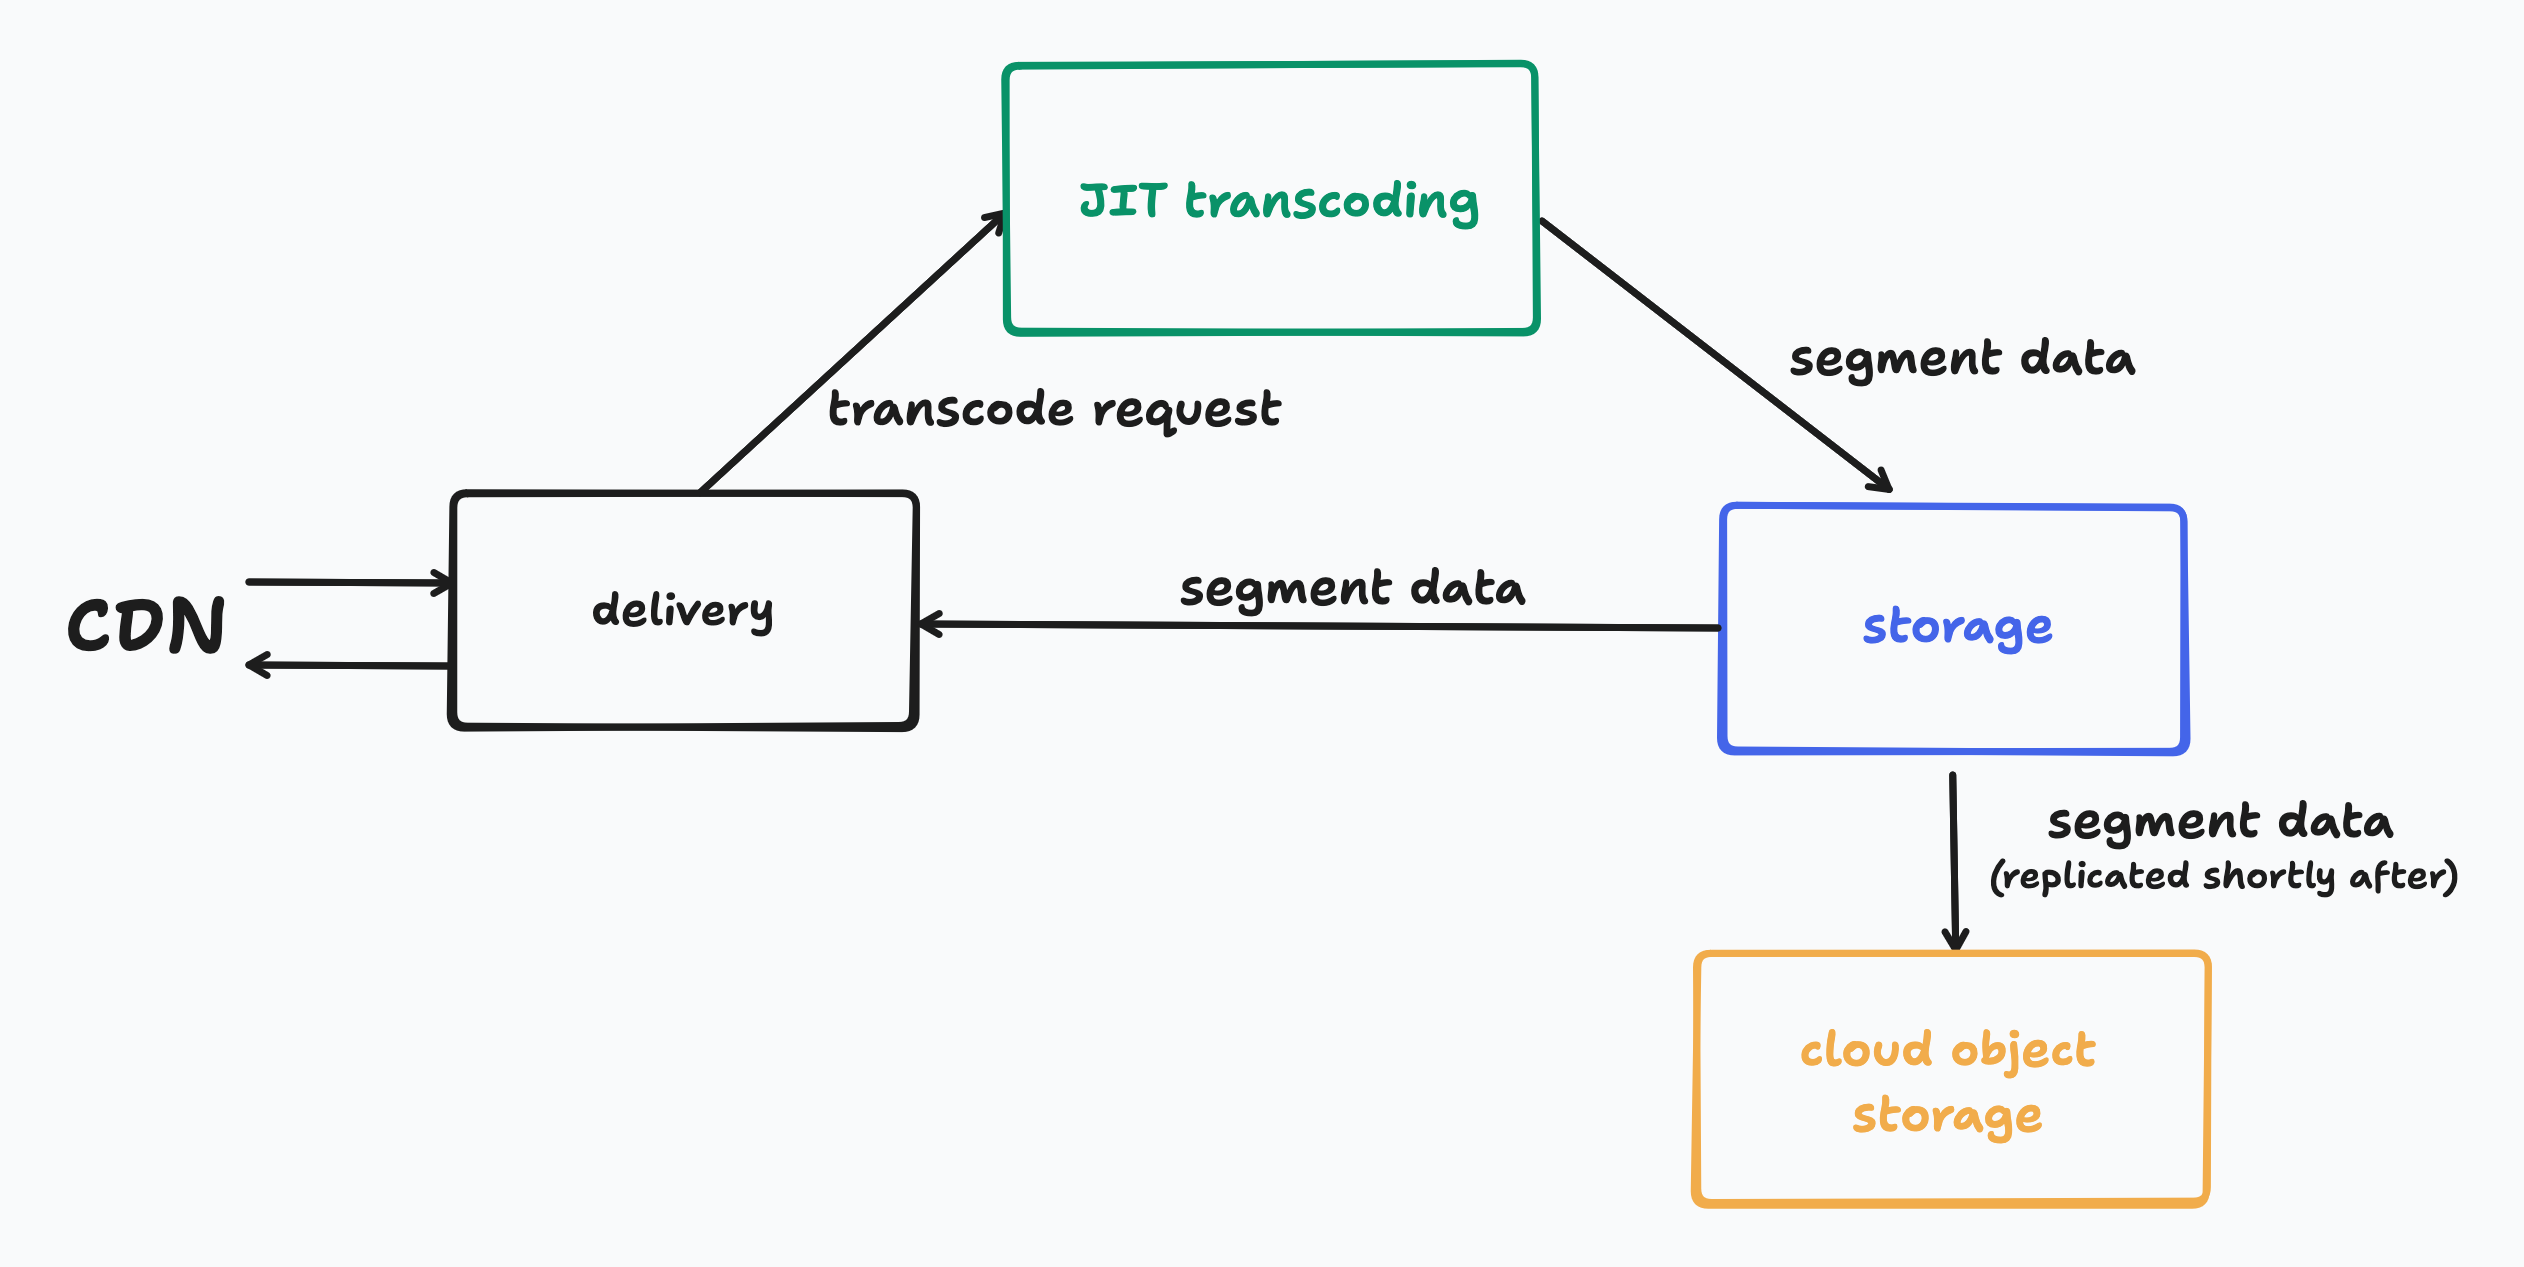
At playback time, our HLS delivery services will request a particular segment from our storage system. If it doesn’t exist, a request will be made to our JIT services to generate the segment while the delivery service waits to start receiving the segment data from our storage system. Here is a very high level visual of the request flow:
While we’re here, let’s take a sneak peek at the new Mux Video Storage system. We’re in the final stretches of rolling it out to all customers and production traffic (we owe at least one blog post on it soon), and it consists of the following components:
- storage-worker, which acts as a read/write cache in front of object storage.
- storage-api, which serves our internal storage APIs and routes requests between workers.
- storage-db, a CockroachDB database for metadata about objects.
- object storage for durable, long-term persistence.
One of the core aspects of this architecture is that it allows files to be streamed out while they’re still being written, which minimizes the latency between operations. This is crucial for both ingest and our JIT engine because, when paired with end-to-end chunked transfer encoding, we can start delivering frames to the player nearly as fast as we can create them. It’s also chiefly the storage system’s responsibility to facilitate, so it’s incredibly important that this system be as robust as we can make it because problems at this layer have far reaching consequences.
With all that out of the way, we can talk about what happens to our party when Murphy adds hot sauce to the punch bowl.
Into the rabbit hole
Part of what made things so difficult to reason about here was that the behaviors involved worked just fine independently. But because we’re in a world of distributed systems, the wrong intersection of them can cause a small cascade of unexpected behavior. I’ll take you through these in the same order we did our internal postmortem: contributing factors masquerading as the root cause up to what we finally attributed as the underlying problem.
Tomfoolery on remote reads
Whether we’re reading mezzanines, renditions, or any of the other content served by Mux Video we of course don’t always need to generate everything on the fly. As discussed above, we rely on Object Storage providers (namely Google Cloud Storage and OCI Object Storage) for long-term, durable persistence. When it comes to our JIT process and we need to retrieve a mezzanine file to generate a rendition, if the mezzanine file we need has fallen out of the storage caches then we will have to go retrieve it from one of those remote storage platforms.
We utilize the same code for serving our JIT’d objects as we do for reading from Object Storage, which means that data is streamed to the requestor while it’s concurrently written it to the storage cache. It also means that we treat those reads like we would any normal JIT interaction in that any errors from the writer (broken streams, etc.) are propagated through to the readers so that they know to treat what they’ve read so far as invalid.
Our services are written in Go, and when we start such a read we use the current request’s context as the basis for the operation. The problem is that if the requester cancels that context, for instance if they only needed to partially read a mezzanine segment, then that cancellation will cancel the remote read operation. If the remote read is cancelled, it will be treated as an error and be propagated to any callers that also happen to be reading that mezzanine segment at the same time.
Unfortunately since we’re often generating adjacent segments that result in simultaneous reads of the same file, those errors can cause those adjacent transcode tasks to fail.
Deletions gone awry
When a file is deleted from storage, three things happen: it gets marked as deleted in our metadata database, purged from storage-worker caches, and removed from Object Storage. Typically, storage workers replicate files to Object Storage asynchronously and shortly after the write request is completed.
However, due to that asynchronicity, if a request to delete an object arrives while the replication of that object is still underway it becomes a race between the delete marking the file as removed and the replication finishing and overwriting that state back to persisted. Normally replications are extremely fast and this window is very narrow, and the worst case is that we retain something we thought we deleted and it will get cleaned up down the line by other processes.
The step where we purge the copy of the file from storage-worker caches helps avoid the situation because purging a file we have not yet replicated will prevent it from being replicated at all. When a storage-api gets a delete request and needs to purge the file, it queries the storage-worker instances to see if any have a copy that should be removed and tells them to do so if needed.
As part of a recent optimization, we moved from a centralized coordination system to a peer-to-peer mesh for tracking which workers hold which files. In the new model, storage-api checks an internal filter to figure out which workers need a purge. But if the delete request arrives extremely quickly after the write is completed and storage-api does not yet know about the file, no purge requests are sent
Normally this isn’t ideal but it isn’t catastrophic, either the copies of the file will naturally expire out of the caches or, if they lost the aforementioned race, they will continue to be served in the unlikely event they are requested again. Unlikely because typically the delete process occurs with other upstream processes that would avoid playback requests being made again.
Fewer nodes, ‘mo problems
We'd noticed that our storage nodes were scaling up and down frequently; sometimes tens of times per hour. This churn was hurting cache effectiveness and pushing more reads to cloud storage, which drove up latency. We were also bumping up against node-level network throttling due to the way our cloud providers allocate network bandwidth.
To fix these issues (as well as a couple of other minor concerns), we moved to fewer, larger storage-worker nodes with more bandwidth. Cache churn improved, but the change introduced new bottlenecks during traffic bursts that slipped past our monitoring and autoscaling dimensions.
This change is what triggered the incident. One of these bottlenecks was that our operations around Object Storage slowed down, which had two main compounding effects:
- Reading mezzanines from cloud storage got slower, which meant that we had more overlapping concurrent reads of the same files. When combined with the context cancellation behavior described above and the fact that we were seeing an increased rate of timeouts from remote storage operations in general, the result was more errors from our JIT pipeline.
- Replication to cloud storage took longer, which widened the race condition window between deletion and persistence.
But “Sure” you may say, operations got slower and as a result things errored more often. But why did that result in corrupted segments?
A curious case of corrupted segments
When a transcoding job hits a terminal error reading the mezzanine, such as the remote read getting interrupted or timing out, it decides to cancel the job and clean up. It issues a delete for the partially written rendition segment so it can be regenerated on the next request. But here's the problem: before issuing that delete, it closes the write stream to storage as though it was a successful write.
Our storage system has extensive error-checking and cleanup mechanisms for streams that are non-gracefully terminated. But a stream that closes cleanly? That looks like a completed, valid file. Storage happily proceeds to replicate it to cloud storage and serve it to any caller that requests it. To make matters worse, this invalidates the assumption that makes the delete race acceptable. If we overwrote a deleted file’s state to indicate that it has been persisted, we would continue to serve it to callers.
Regrettably, this is not a new bug; our old storage system had this same fundamental behavior but in practice rarely if ever encountered it due to differences in the architecture and code-level implementation.
So here we are: several small contributing factors and one API contract/assumption invalidating bit of client behavior culminating in a perfect storm of bad behavior. You now know how we got here, so all that’s left is to discuss what we did about it.
What made this harder to find
No two ways about it: this system is complex and reasoning about its most intricate workings can be challenging. But two things in particular made this harder to crack than it should have been.
We were too slow to connect the dots. Early customer reports of playback issues came in within days of the triggering deploy, but we treated them as isolated cases. Triage started but moved slowly, with gaps between follow-ups. More reports trickled in over the following weeks. It wasn't until we'd received multiple end-user reports that we recognized the pattern was systemic.
This is a systemic challenge we're still working on: how do you distinguish signal from noise when individual reports look unremarkable? We're rethinking how we correlate support tickets with deployment timelines and how we escalate patterns that span multiple customers.
Our application logs were being silently dropped. Through the rollout period of the new storage system, we'd instrumented careful logging. During this incident, we discovered we had crossed a scale threshold where our log ingestion pipeline was being rate-limited and quietly discarding logs. Ironically, we ended up with less information as a result, which made it significantly harder to reconstruct what was actually happening.
How we fixed it
Stopping the bleeding
We’d reasoned our way through the contributing causes and deployed the following three fixes on January 29th, 01:57 UTC:
- Fixed the purge path so that file deletions stopped encountering the replication race.
- Fixed the context cancellation issue on mezzanine reads. Remote reads from cloud storage now use a background context, so one transcoding job cancelling its read no longer takes out all the concurrent readers of the same mezzanine.
- Bumped the storage node count to clear the bottlenecks from the scaling change that kicked this whole thing off.
From this point on, we stopped seeing new corrupted segments.
Regenerating every affected segment
Once the bleeding had stopped, we still needed to deal with the segments that were already corrupted and actively being served to viewers. After much deliberation and with admittedly fairly limited options, we landed on a (coarse) approach: mark every rendition segment generated during the incident window as needing regeneration. The next time any of those segments got requested (whether because the CDN cache expired or we explicitly purged it), the system would see it marked as deleted, know it needed to be rebuilt, and fire off a fresh JIT transcode.
Because we had those gaps in our logs and couldn’t trust them outright, to calculate a list of impacted assets we leaned on our data warehouse to build a list of every segment we generated during the impact timeframe. The tricky part was scale; our storage metadata database has billions of rows and isn't built for full table scans, not to mention for the number of assets we needed to process. We reworked an existing tool we’d built for applying database updates in bulk, fed it that data and some carefully crafted queries, and set it to running.
Two cloud regions were done by February 1st. The third was a different story; its database cluster was smaller and couldn't handle the remediation load. We had to pause, scale up the cluster, and pick back up. That region finished on February 3rd.
Clearing the CDN caches
The last piece was that corrupted segments sitting in CDN caches would keep getting served to viewers until they expired or got purged. Our CDN cache TTL for rendition segments is 7 days, but in practice, LRU eviction clears out everything except the most popular content within a much smaller time window. Waiting up to 7 days for corrupted segments to naturally expire meant viewers would keep hitting playback issues in the meantime, so we needed to take a more active approach.
This, thankfully was more straightforward: we queried our CDN logs to find the assets from the incident window that could still plausibly be cached, then ran targeted purges over the course of a few hours. That wrapped up on February 3rd.
What we're doing next
There's no denying that this was a doozy of an incident and now that we've dealt with the immediate contributing causes, we are very invested in preventing this from happening again.
- We know the scaling change triggered this, but we're still investigating exactly why it caused the operational slowdowns it did. This shouldn't have caught us by surprise. The right mitigations are in place to prevent recurrence, but we need to understand how this system behaves under more scenarios so we know where the dragons are.
- Customers and end users reporting problems before we notice them is our worst-case scenario. This incident exposed gaps in our transcoding pipeline observability. We're adding coverage to capture missing error signals and detect unusual trends that can lead to corrupted segments. We've also fixed the dropped logs issue and added alerting so it doesn't sneak up on us again.
- We're rethinking how we manage support escalations to connect the dots faster when multiple customers report similar symptoms.
We hope this has been helpful and if nothing else, an interesting read for the kinds of gnarly problems that can crop up when operating video infrastructure as scale. If you have questions about this incident or how it may have affected your assets, please reach out to support@mux.com.