
2023 was a busy year, and the Mux team was busy building the best for our customers — from scaling and breaking records to furthering our ad support, among others. While all these were great, I’m the most excited about this update.
Finding actionable insights that help you improve the quality of your users’ experiences is vital. Doing so at speed and with great accuracy is a difficult problem we aim to solve at Mux. We are always looking for new ways to improve how we present your data so you can get to the root of your users’ problems as quickly and easily as possible. In that vein, I’m excited to announce that today Mux is officially launching its new metrics filtering capability, which will further enhance your dashboard experience.
When I say I have been so SO excited for the launch of this feature, I mean it. I have been wanting to add this feature since our team first came up with the idea, and I’m so glad that the wait is over.
[Okay, we get it, Mani, you really love it… so tell us: what is metrics filtering?]
Metrics filtering is a new feature in the Mux Data Dashboard that allows you to set criteria for how you want to visualize your video data. As the name implies, metrics filtering enables you to filter your data by values or a range of values for a specific metric or set of metrics. For example, with this new feature, you can filter data above or below a certain number of seconds for the Live Streaming Latency metric or set a threshold for the Overall Viewer Experience Score.
Metrics filtering in action
Okay, so let's set the scene here.
You are the on-call operations agent during an important live football game, and you’ve just observed several high spikes of rebuffering during the game. As a bonus, it’s your favourite team playing — Manchester United, of course — so you’re extra concerned about what viewers (and fellow Man United fans) are experiencing.
Your first stop is the Mux Monitoring Dashboard, where you find that the rebuffering is specifically affecting iOS devices. This is a great starting point, but you want to gather as much detail for the engineering team as possible, so you continue to investigate.
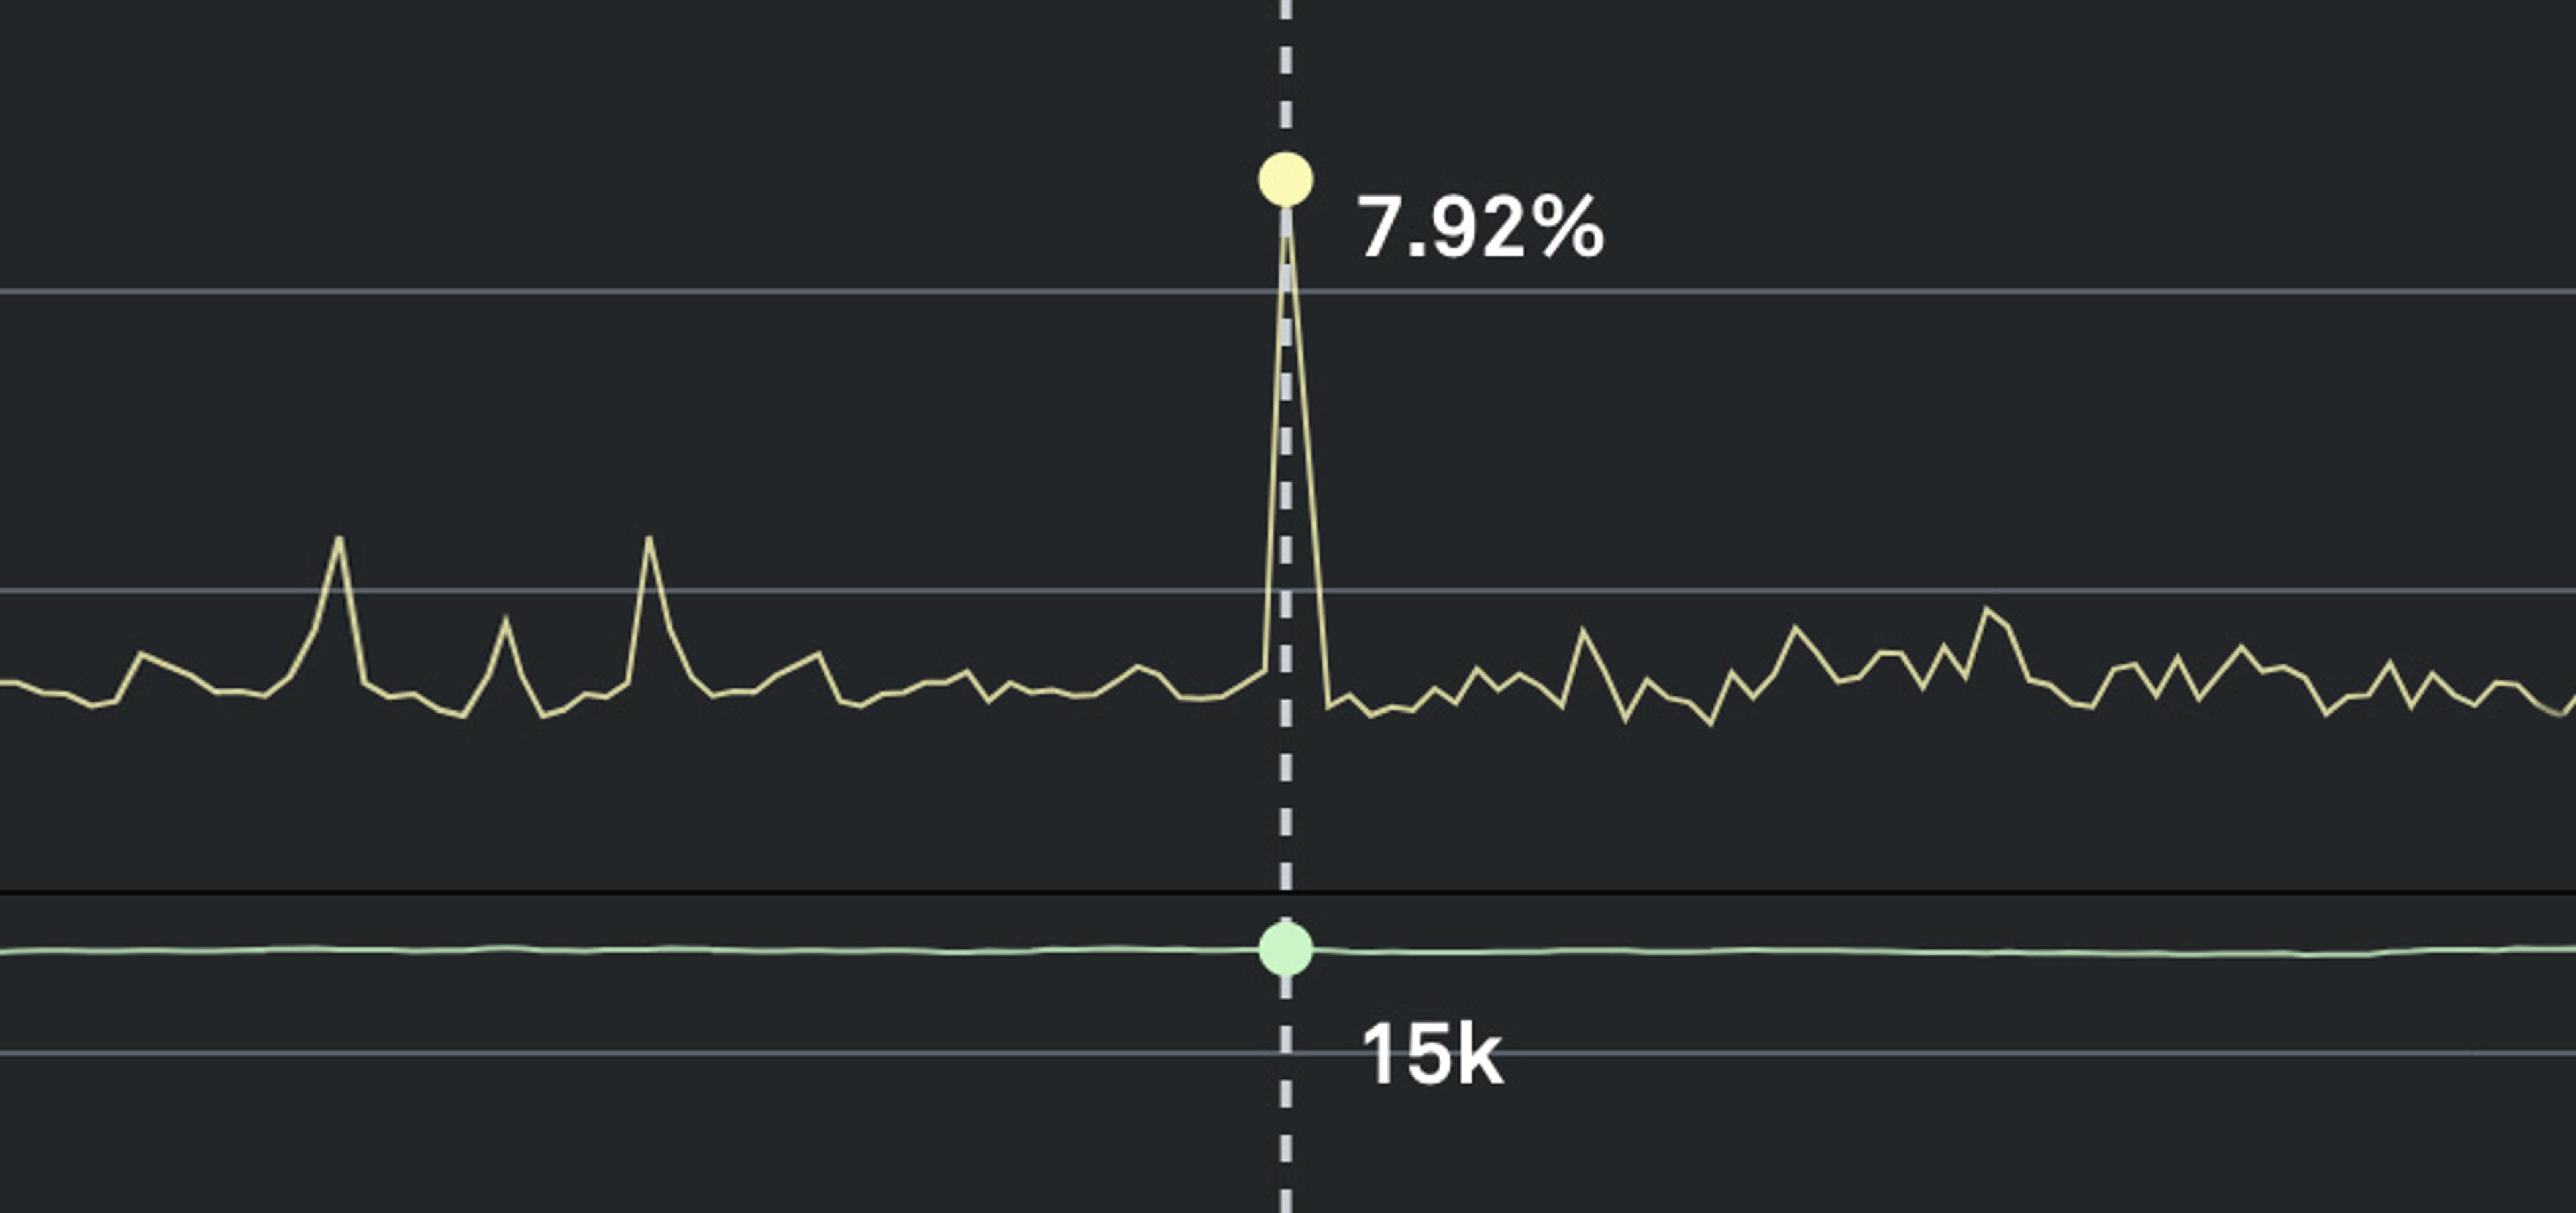
Next stop: the Mux Metrics Dashboard. You bring up the Rebuffering Percentage under Smoothness Score and adjust the time range to the last 60 minutes so you can view the data with a 1-minute granularity.
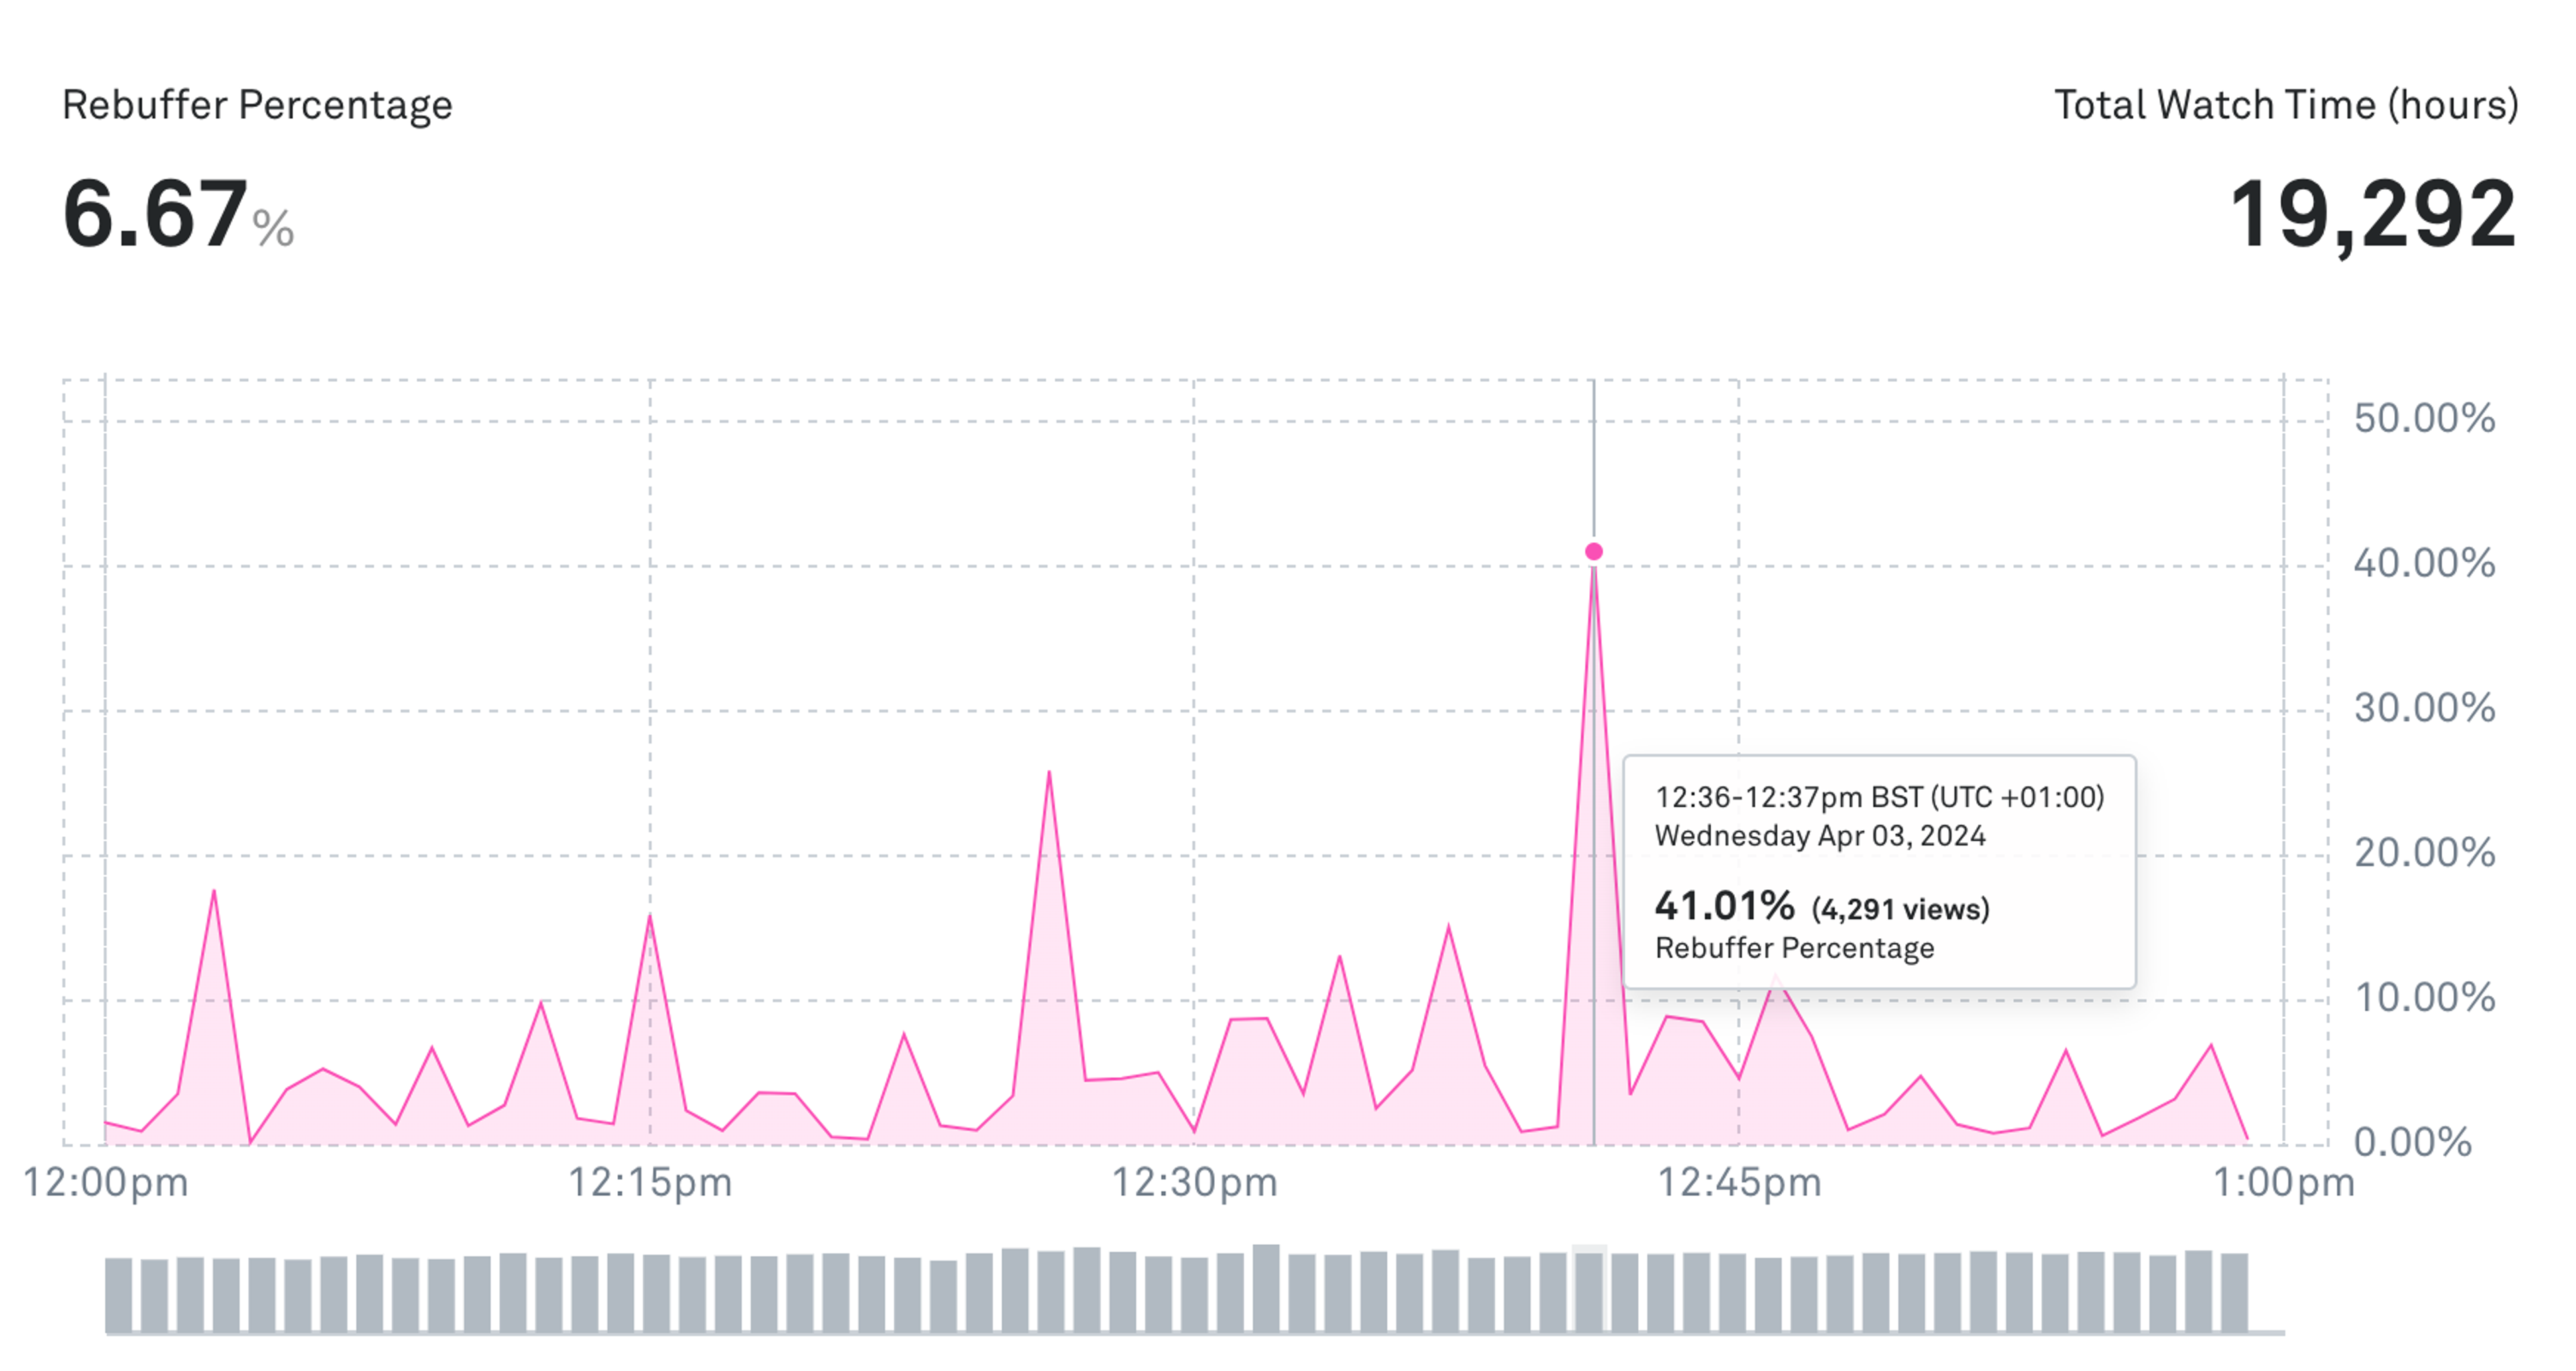
This is usually the point where you would look to Insights for values that could be contributing to these poor experiences, followed by a look into individual views to get an idea of individual experiences. However, since your first priority at this time is identifying the worst viewer experiences, you want to be able to quickly identify and get insights into those views so you can take action faster. But how?
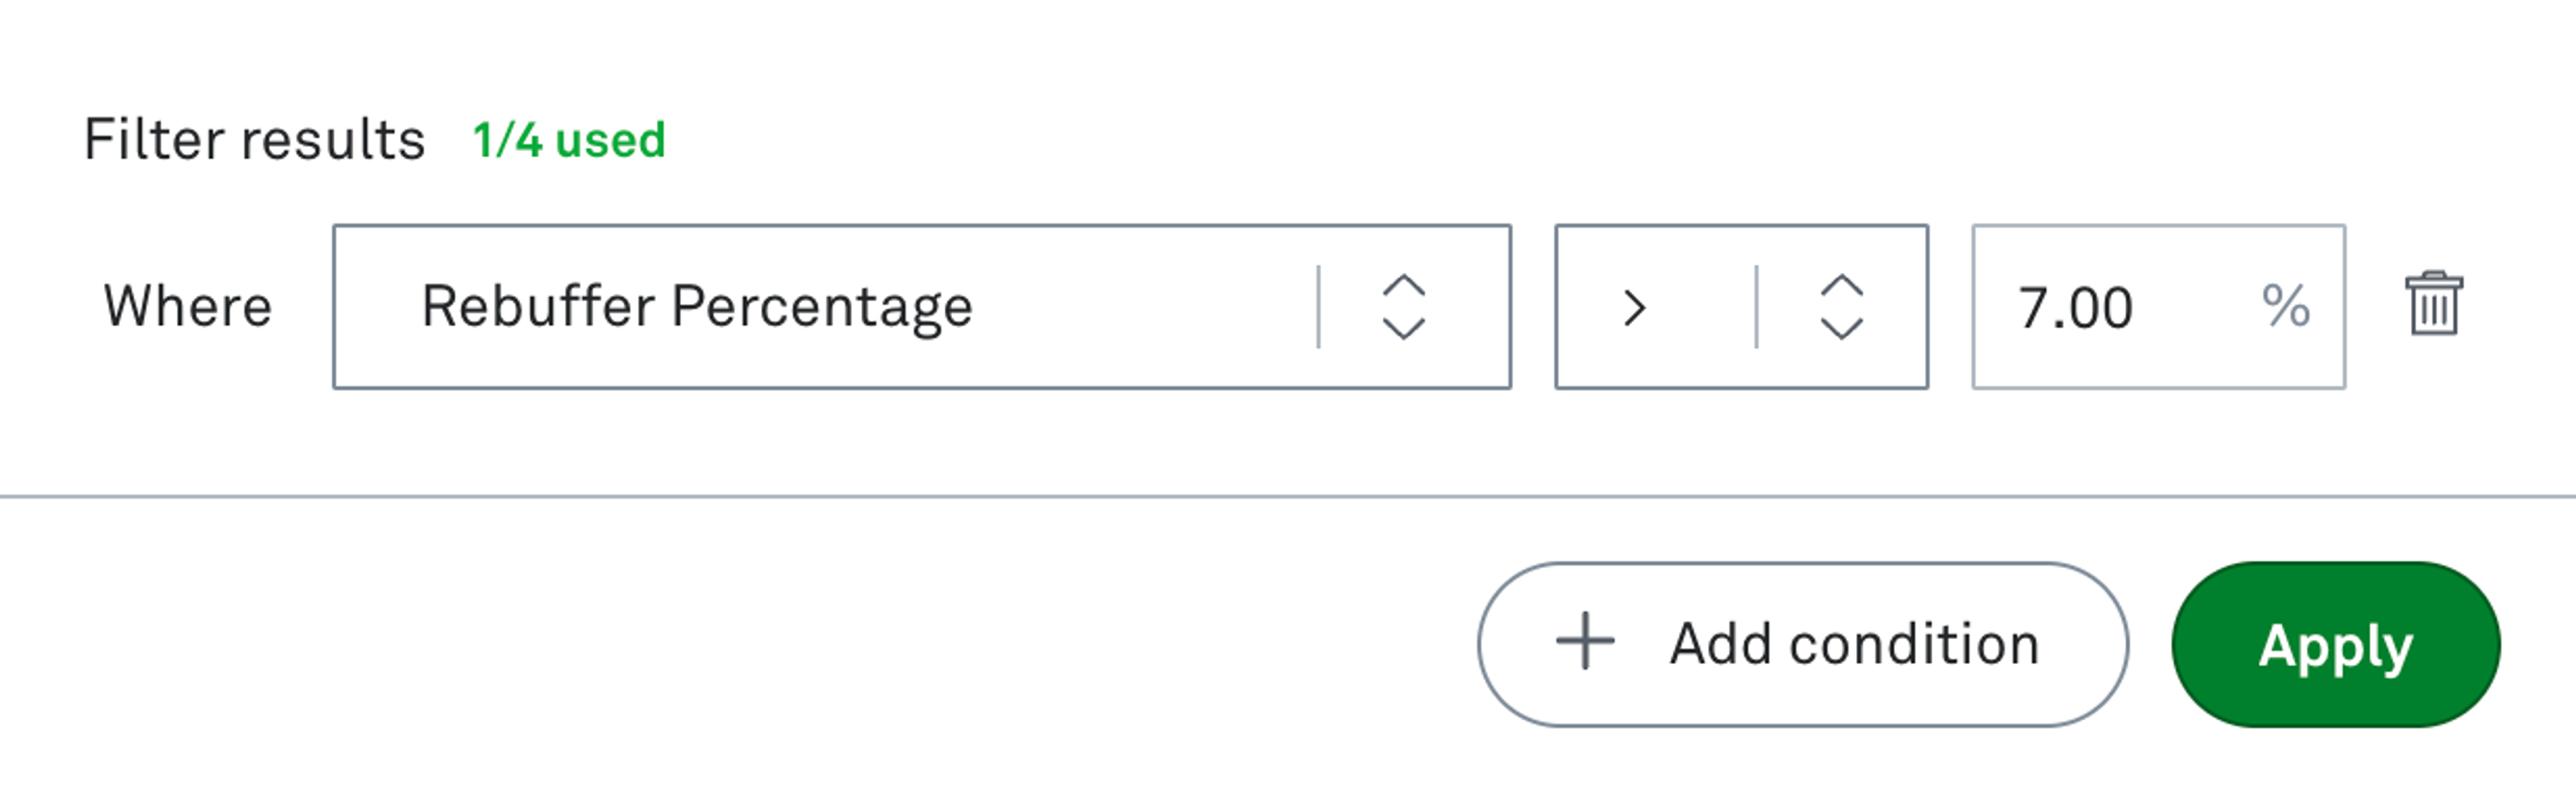
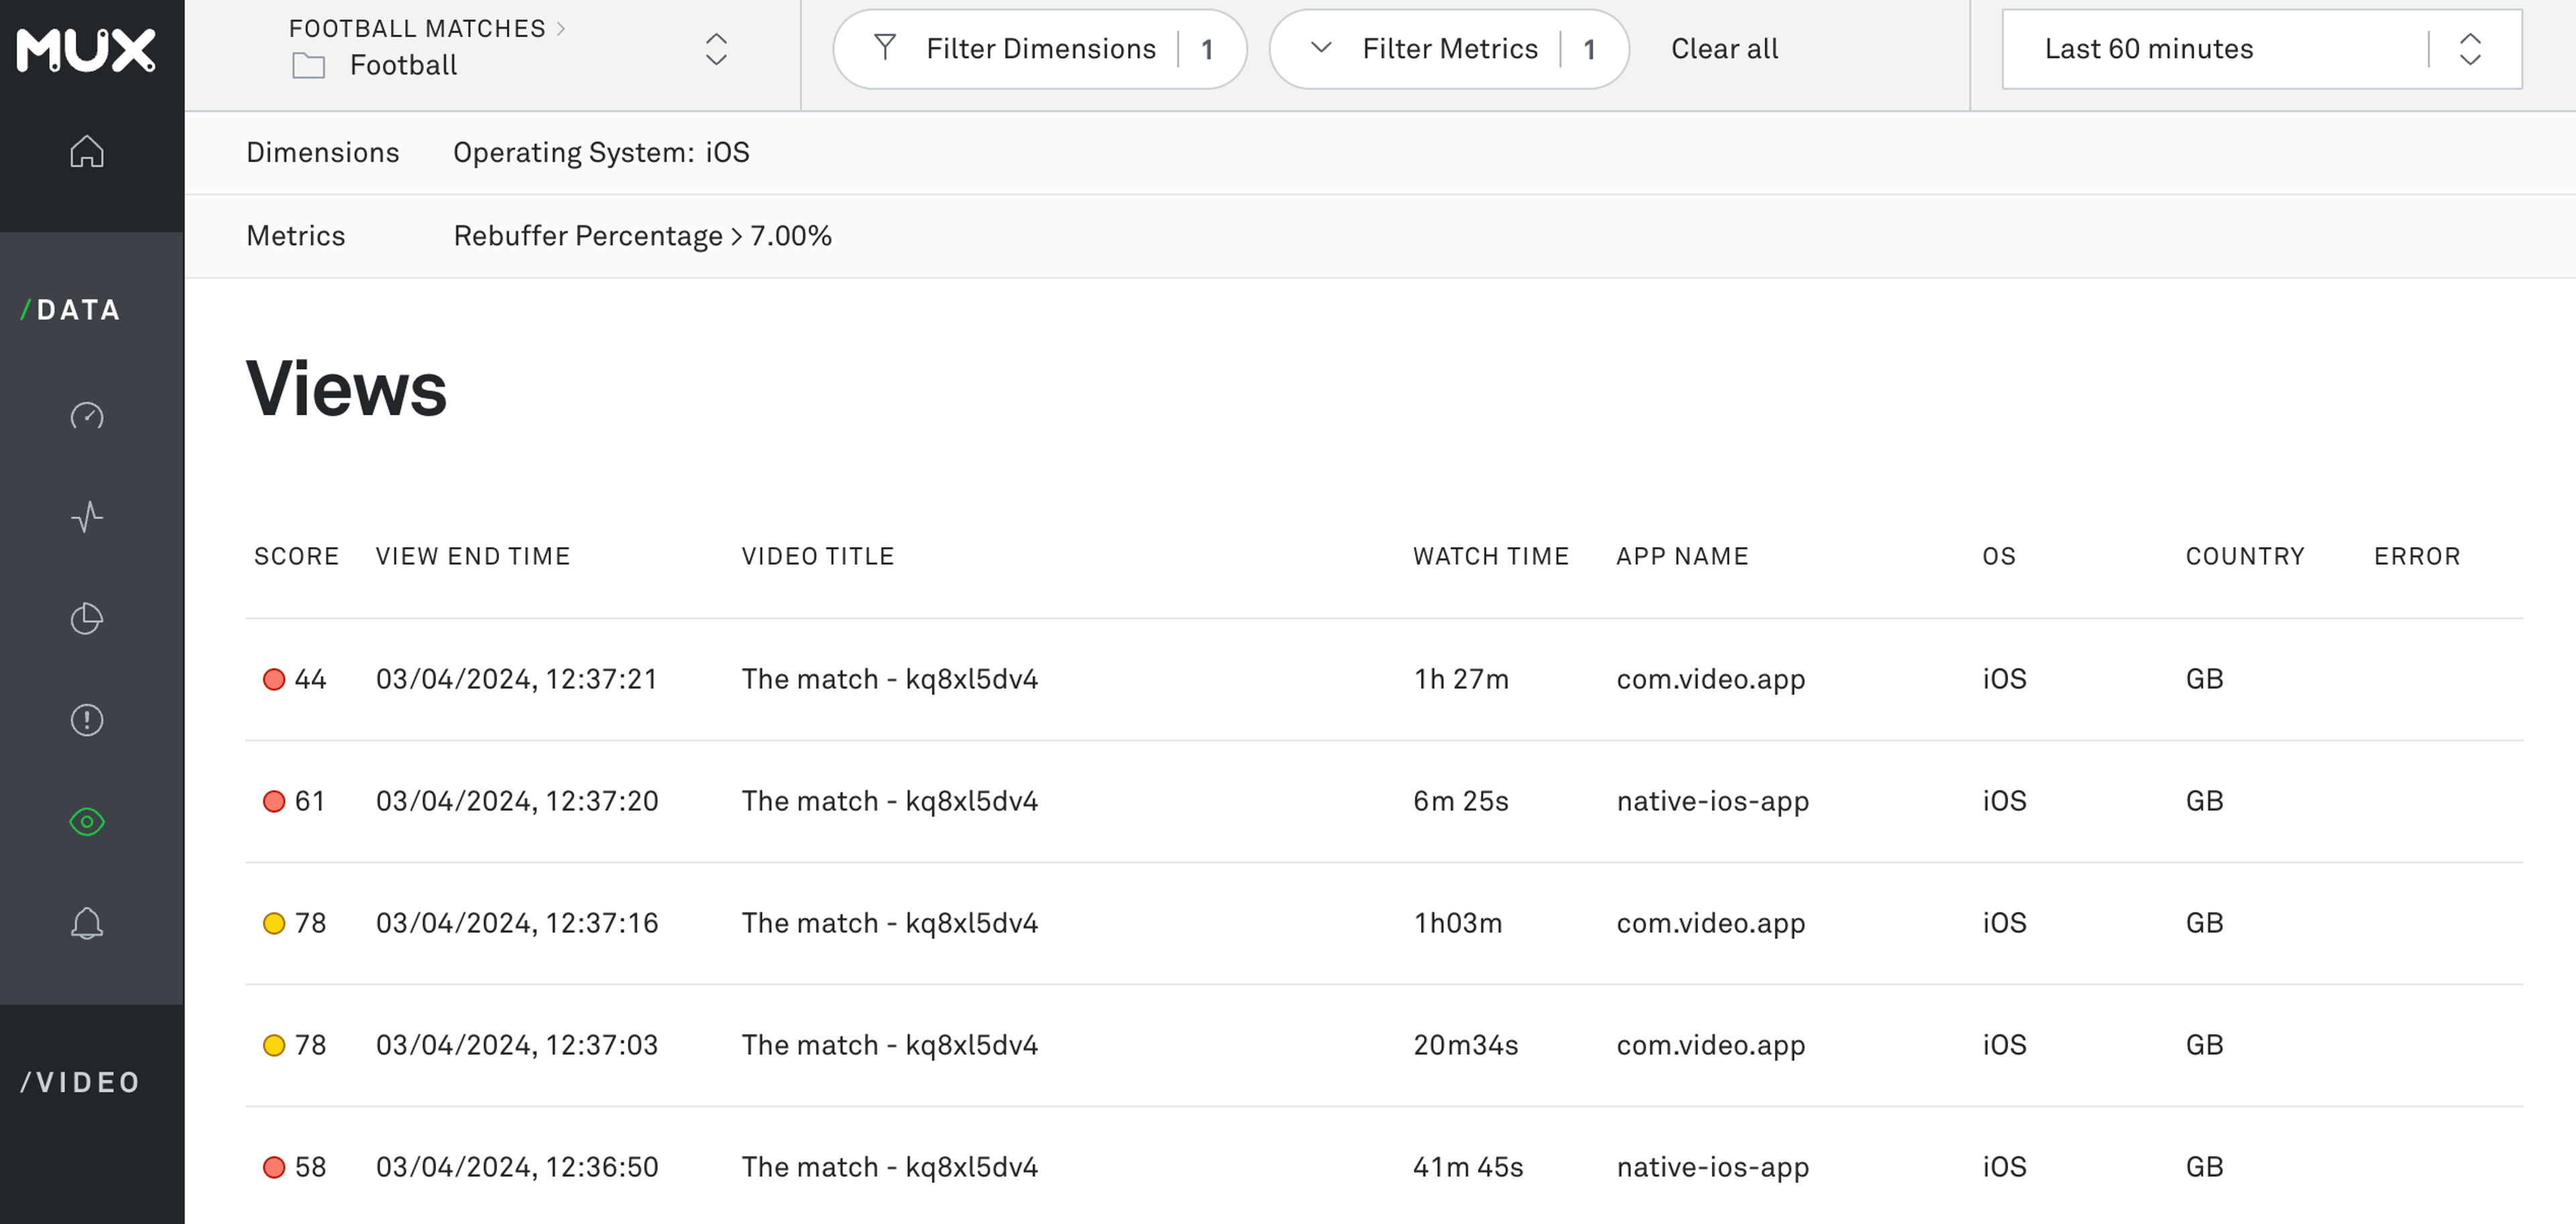
The answer: metrics filtering. With this feature, you can filter the Rebuffering Percentage to show only those views where the percentage was greater than 7%.
Now, you can go into the Views page and start looking into the individual views to find the commonalities across the poor performers.
Of course, this is just one scenario.
You could also be a product manager who is reviewing the historical performance of your videos and thus wants to filter the live latency of your streams.
Or maybe you’re part of the advertising and marketing teams and want to understand the engagement or error rate of specific campaigns.
Or maybe you’re a support engineer listening to an angry customer talk about the crashes they’re experiencing while attempting to watch a certain live reunion show...👀
All of these scenarios — and countless more — are important to investigate, and metric filtering can help you quickly identify the poorest experiences, therefore reducing your incident mean time to identify (MMTI) or mean time to resolve (MTTR).
Getting started
Metrics filtering is available for Mux Data Media customers. To get started, go to the Metrics Dashboard and select the filters that you want to use.
You can use up to four filters at a time. Each additional filter will use an AND filter logic to the one before it. All metrics that have numeric values assigned to them are available as filters.
And okay, I know I’m biased because I work at Mux. I’m obviously going to say I love everything about Mux — and especially metrics filtering (it sounds so cliché, but I really do) — but that’s why I’d love for you to check it out next time you’re troubleshooting or looking into some poor user experiences and share what you think of it. I’ll bet it’s going to be a super positive experience, but all of your feedback ( positive or not) is invaluable to us.
(Please note, the examples used in this post are fictional)