
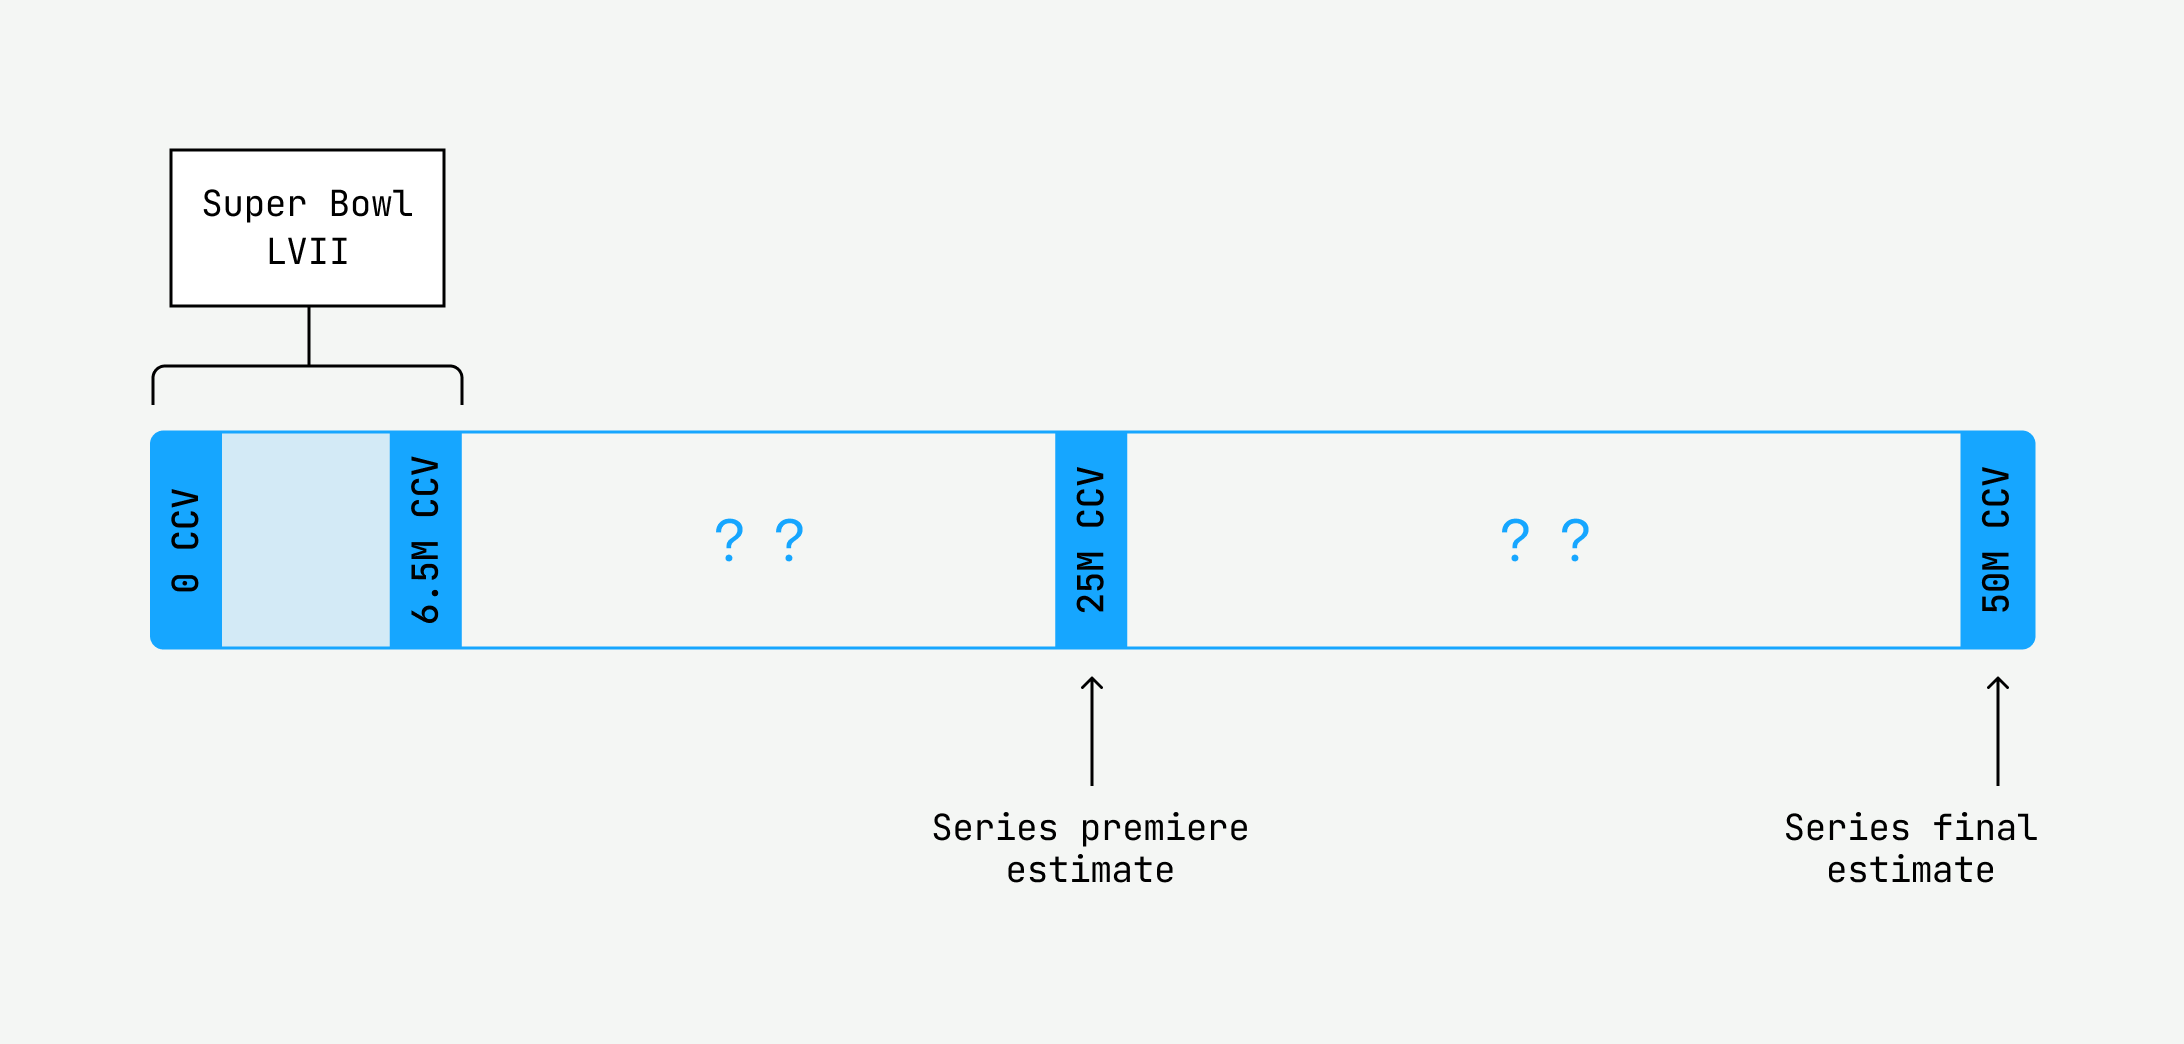
I squinted at the title of the unscheduled meeting placed on my calendar: “Team Reprioritization.” Uh-oh. As we trickled into the Zoom meeting, I couldn’t help but feel a sense of foreboding. We had just successfully supported Super Bowl LVII on Mux Data; what is it now? Our manager gave it to us straight: “We’re going to support an upcoming event which will last over a month and have an estimated peak of over 50 million concurrent viewers (CCV).” I ran the numbers in my head. That’s eight times the scale of the Super Bowl! Sheesh. “Also, since it’s a long-running series, we can’t throw excessive compute at the system. First priority is the customer, second priority is COGS.” I groaned inwardly. We had a lot of work ahead of us. This is the journey of how seven Mux Data engineers conquered unprecedented scale, ballooning infrastructure costs, and a tight timeline.
But first, here’s a quick rundown on the critical components within the Mux Data architecture.
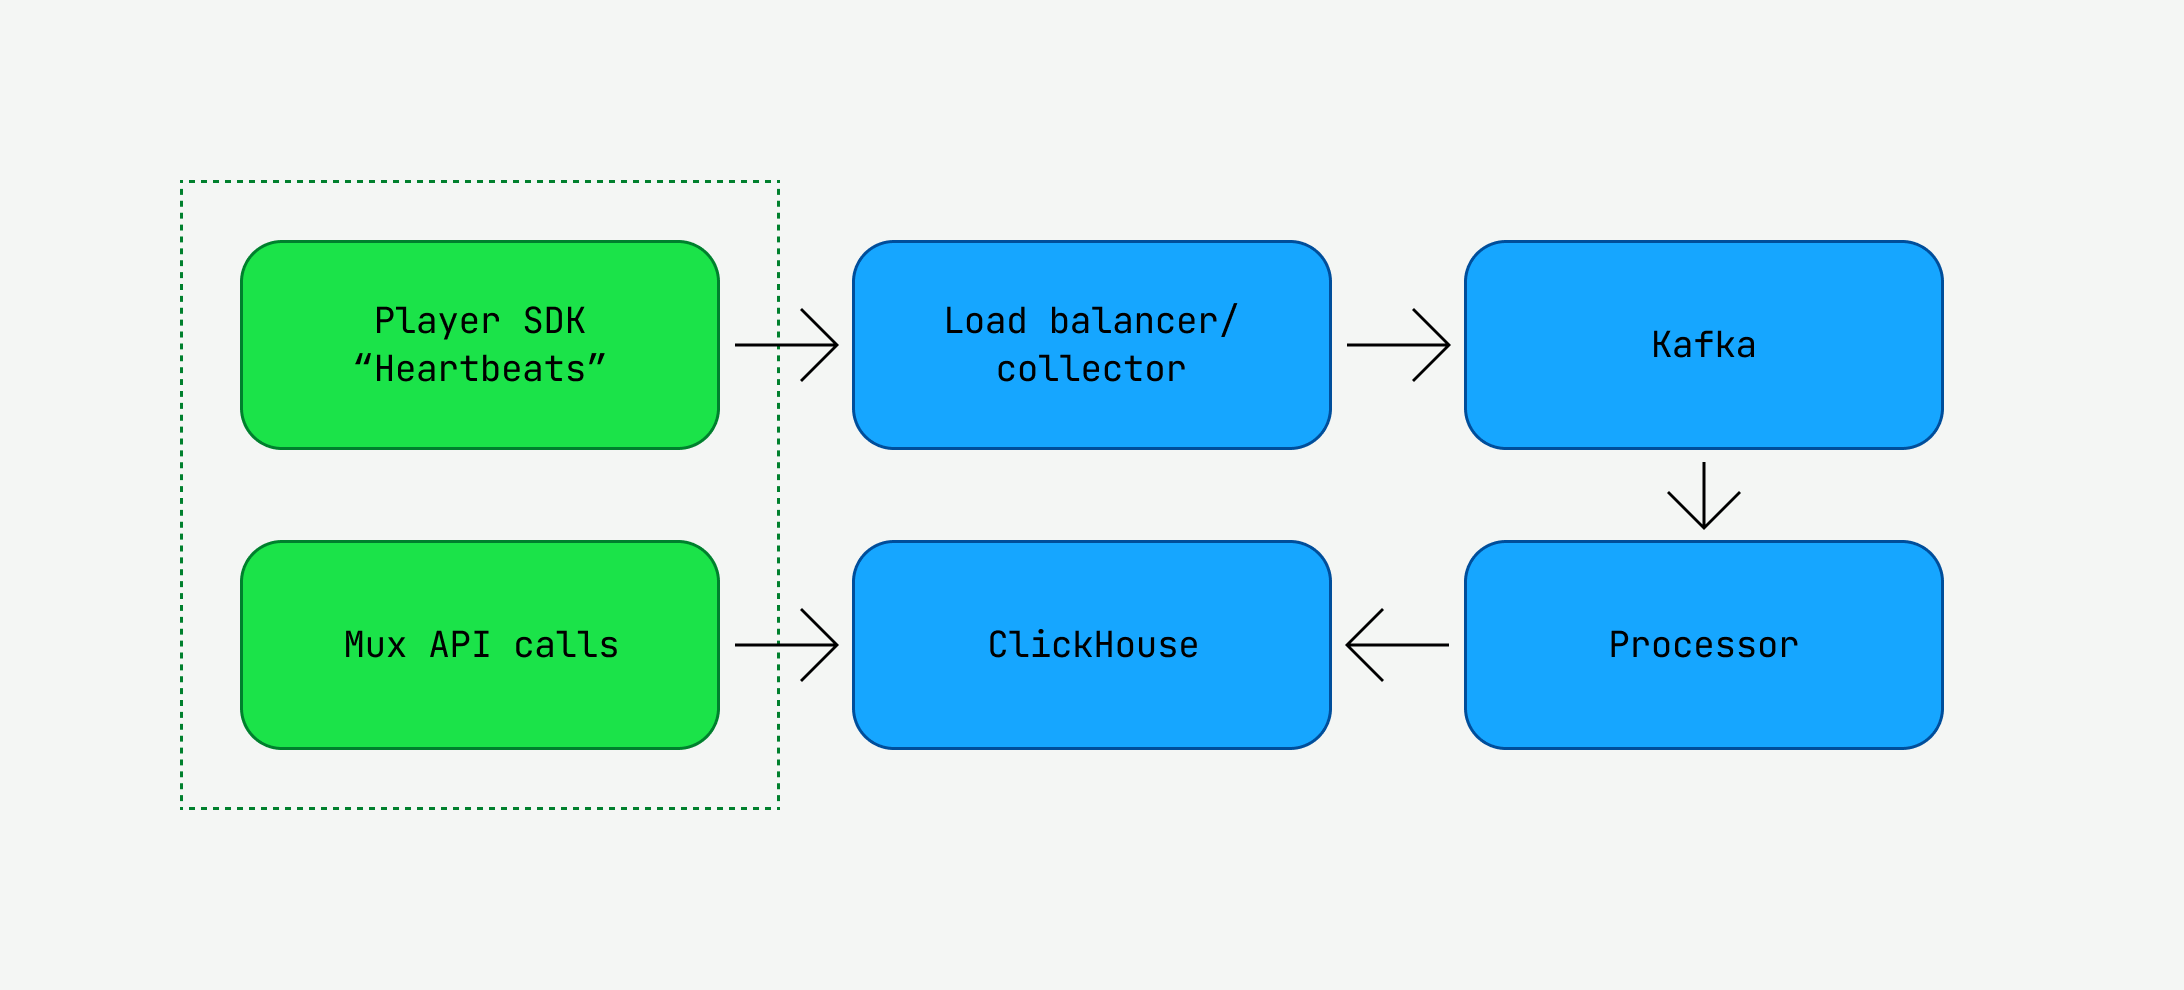
At the edge, an end-user watches a video from a Mux Data customer, like anime from Crunchyroll or the Super Bowl from Fox Sports. Our SDKs heartbeat every 10 seconds, recording Quality of Experience (QoE) data such as video startup time and rebuffering percentage. They are important metrics for the Mux Data customer. These heartbeats flow to our data pipeline, built through a collection of Golang applications, until they eventually end up in queryable OLAP databases — in our case, ClickHouse. Our APIs expose the persisted data to Mux Data customers. In this manner, we collect, store, and analyze QoE data for our customers. If any single service within the pipeline failed, our customers would immediately realize it through API request failures or visual regressions in the monitoring dashboard. And, simply put, we hadn’t tested any of the services at the scale we were attempting to achieve.
This was going to be a massive headache.
So what could we do to gain confidence in our systems at scale? The answer: end-to-end load tests. Load testing would help us answer crucial system questions to meet this challenge.
- What were our bottlenecks?
- How much traffic could we handle without changes?
- What changes would successfully increase the traffic levels we could support?
There were just a few… challenges
It was clear we needed to load test to be able to support the load of 50 million CCV on our systems. Of course, we had load tested our infrastructure before to support events like the Super Bowl, so it’s not like the concept was completely foreign.
However, our previous load testing efforts usually consisted of one-time verification that our system worked end-to-end to support a target level of scale. These tests were often rushed and set up haphazardly. We typically coordinated operations via Slack, which produced long, convoluted threads in posterity. This time, if we wanted to support 5x the scale we had ever seen, we knew that load testing could not be a one-time deal.
We needed to intentionally adopt a set of strategies to offset the following hefty challenges:
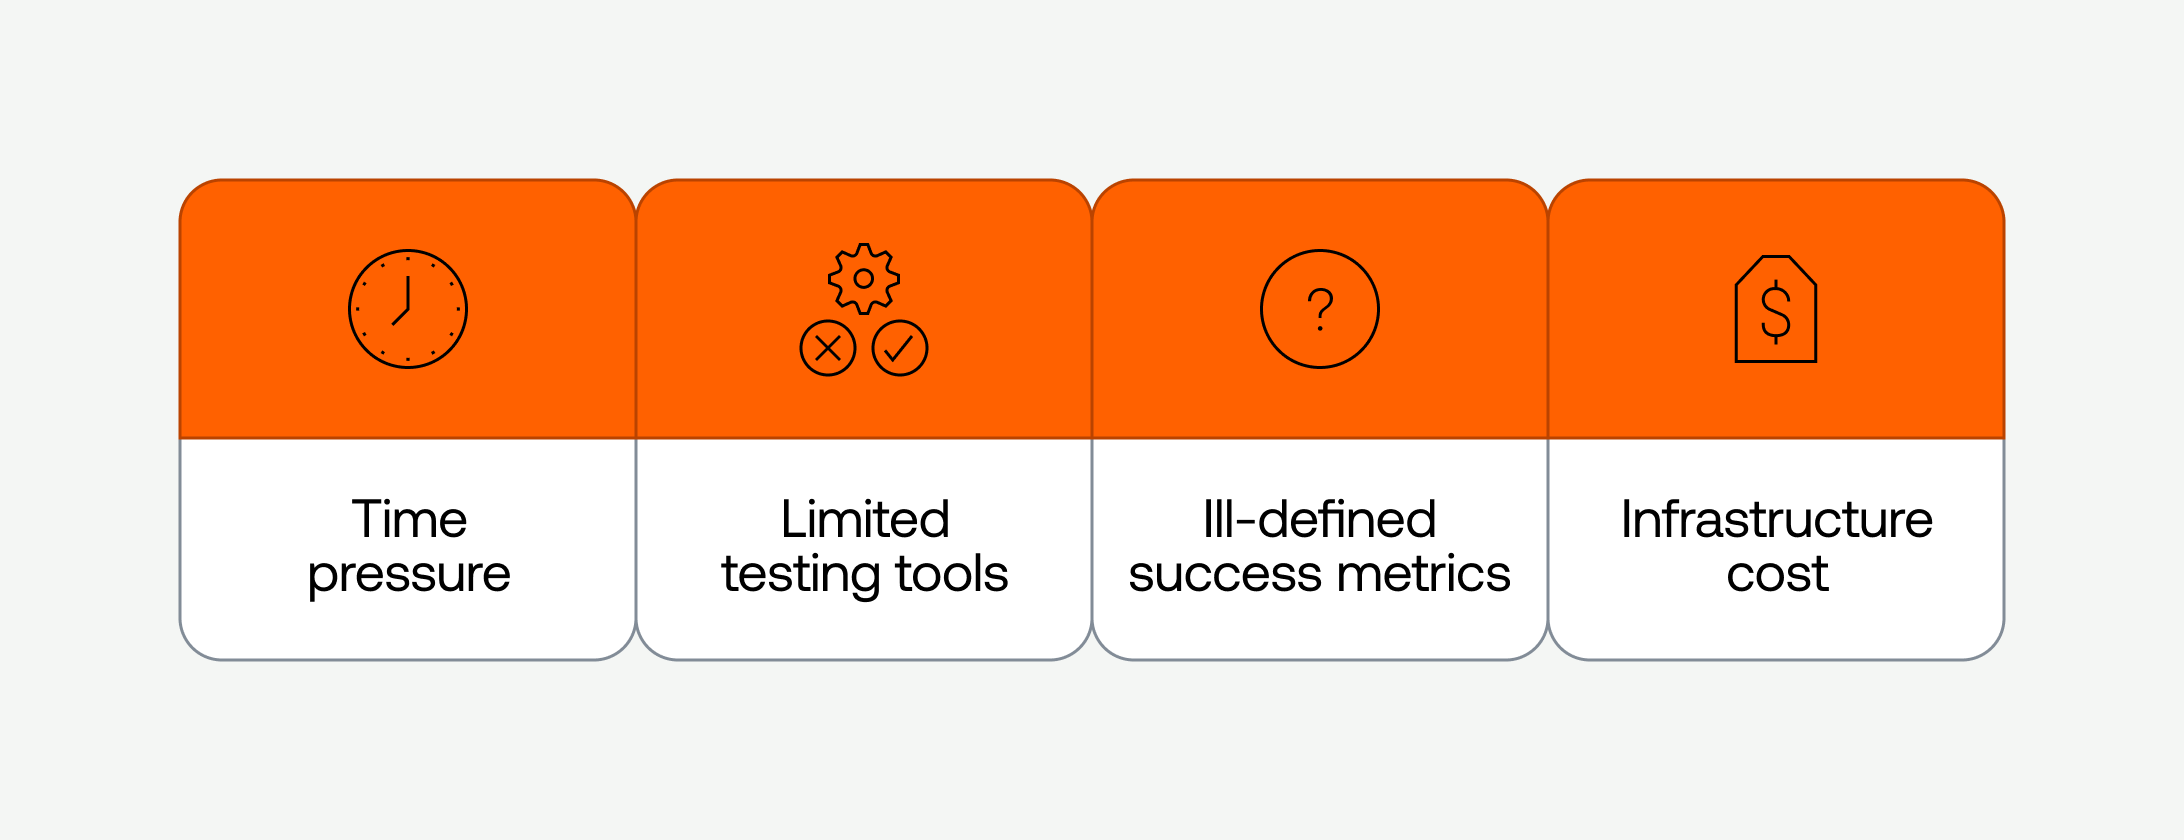
- Time was our enemy. Scaling a distributed system is no easy feat, even when you have plenty of time to prepare. The unfortunate reality of unprecedented opportunities at start-ups is that timing is never guaranteed and not always convenient. In this scenario, we had only a month of advance to load test.
Action: We needed a predetermined structure for storing the results, clear metrics to determine the success and failure of tests, and a repeatable playbook for generating load in a reproducible manner.
- Tooling and reporting resources were limited. Prior load testing efforts focused on proving that a given system configuration could scale to the necessary levels. We had some existing custom tooling to generate load for our system, but each tool had its own set of limitations and drawbacks.
Action: Given our time restraints, we decided to stick with the custom tools we had developed for reproducing customer traffic, while developing new tooling to cover existing gaps to test the collection edge layer.
- Success metrics were hard to define. What does it even mean to successfully handle 50 million concurrent viewers? At a high level, we wanted to avoid downtime and data loss. However, if we wanted to rigorously repeat load testing in order to reach new thresholds, we would need to define more precise success and failure metrics.
Action: We focused on metrics that could be clearly mapped back to customer experience: Overall processing latency needed to stay under 30 seconds for writes, error rates should be under 0.05 errors per second, and p90 read latency should remain under 750 milliseconds.
- Cost. With unprecedented scale comes unprecedented costs. The time pressures likely meant we could not invest in testing individual components of our system in isolation, which implied we would need to run a system that was several times the scale of our normal data stack just to test.
Action: We would continually drive down the time and effort of deploying and destroying the lab by measuring and recording the time alongside test results and iteratively scripting manual spin-up and tear-down steps each time we ran initial tests.
To be honest, we weren’t sure how this load-testing effort would go. We had no guarantees we would succeed in identifying and overcoming bottlenecks in time for our system to be fully prepared with the timeline we had been given. But we had our experiences with load testing for the Super Bowl to draw on; we knew what had worked, what didn’t work so well, and what unique challenges were ahead of us. The only thing to do next was pull on our gloves and get to work.
Setting ourselves up for success
Defining our success and failure metrics did not take long. We set up some Notion tables and templates for recording results. Here’s a rough outline of what that looked like:
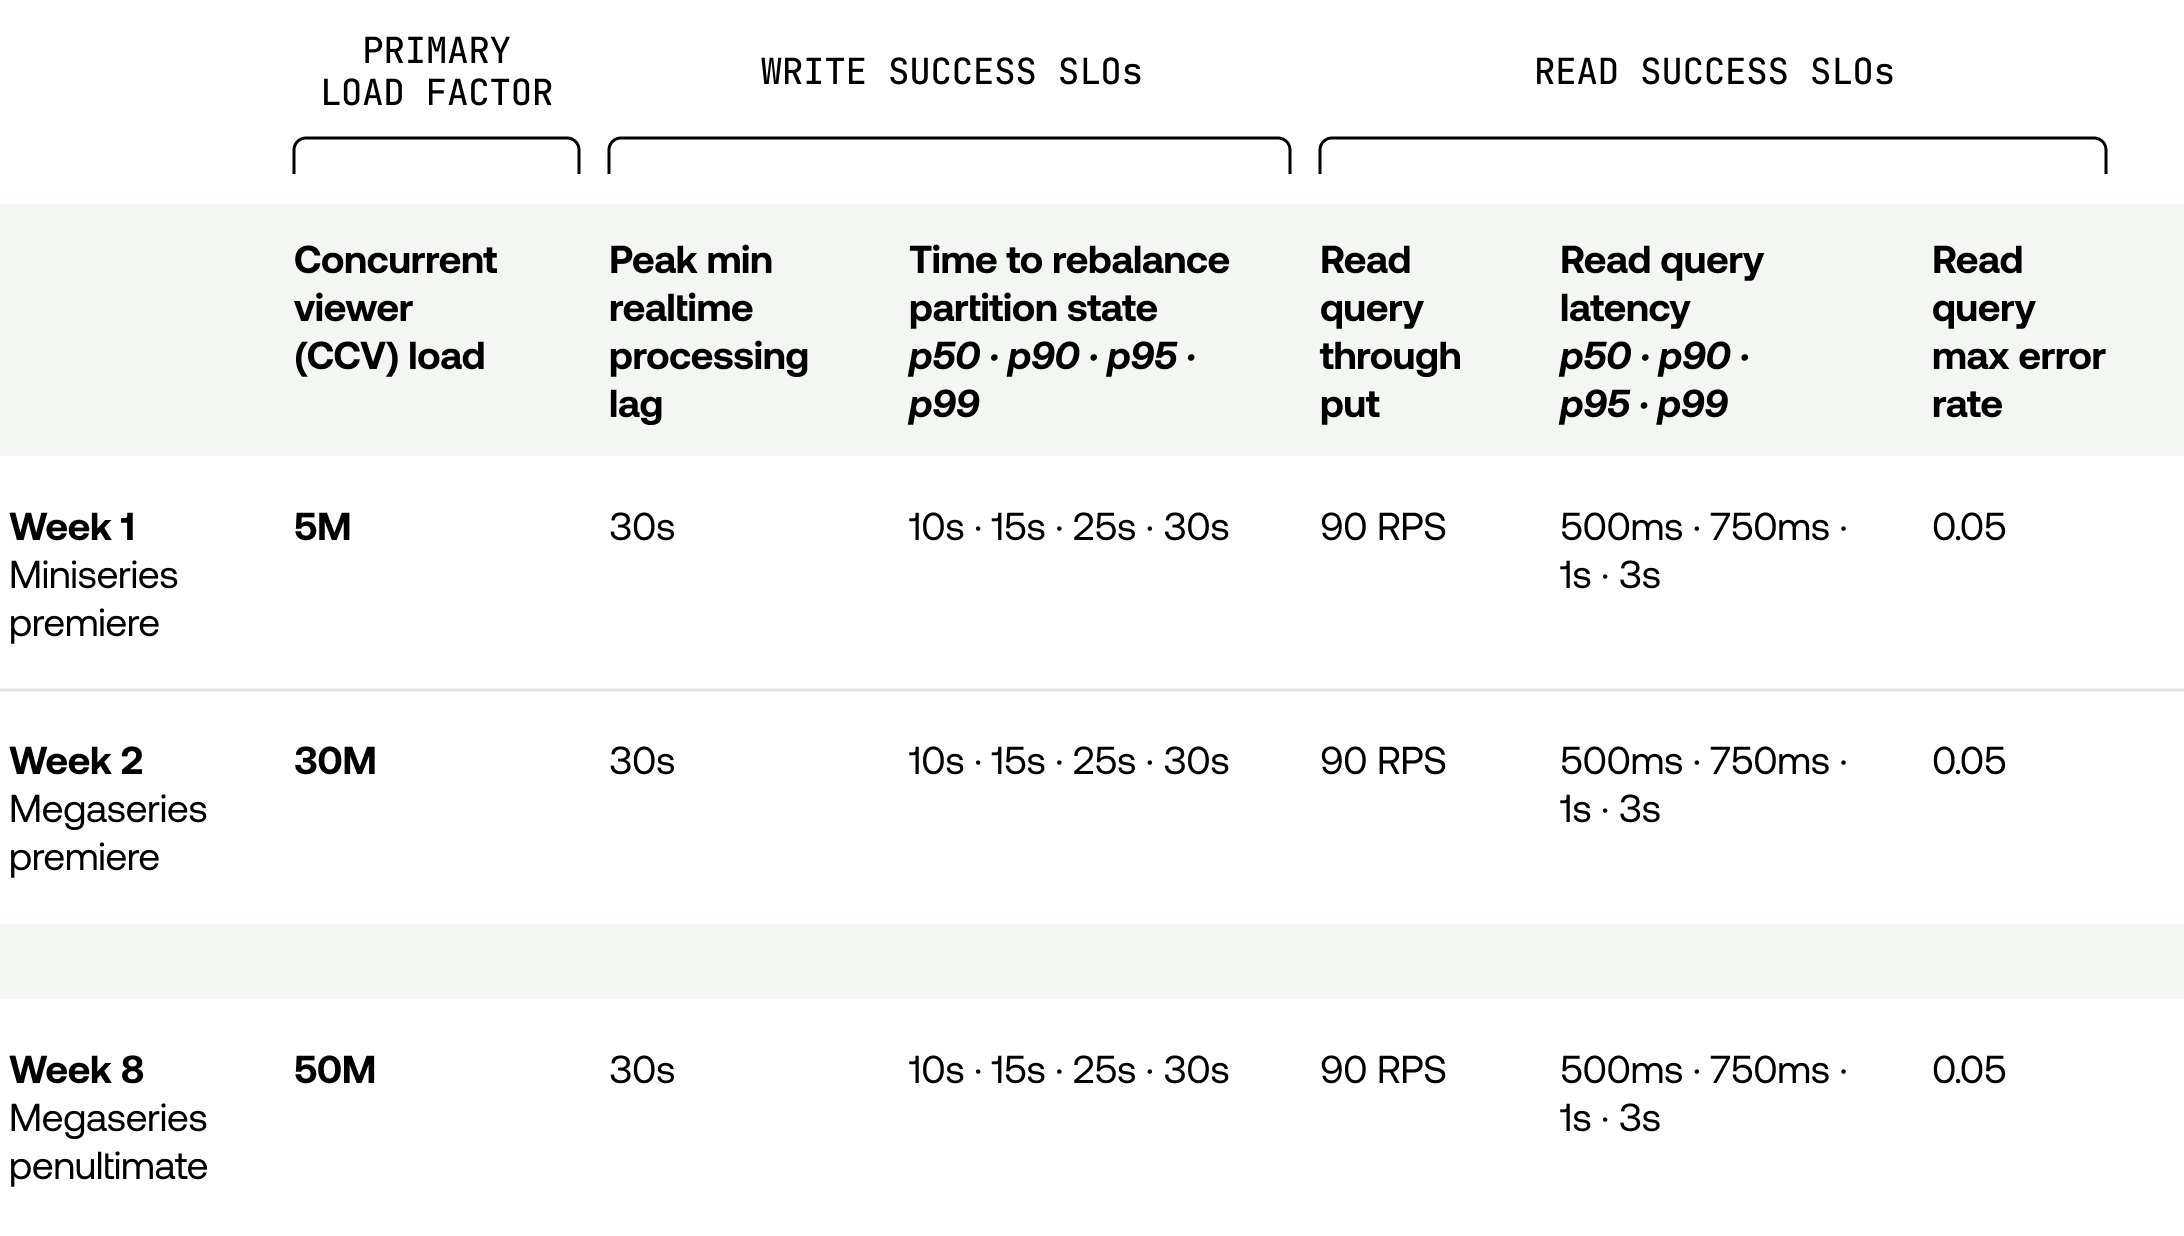
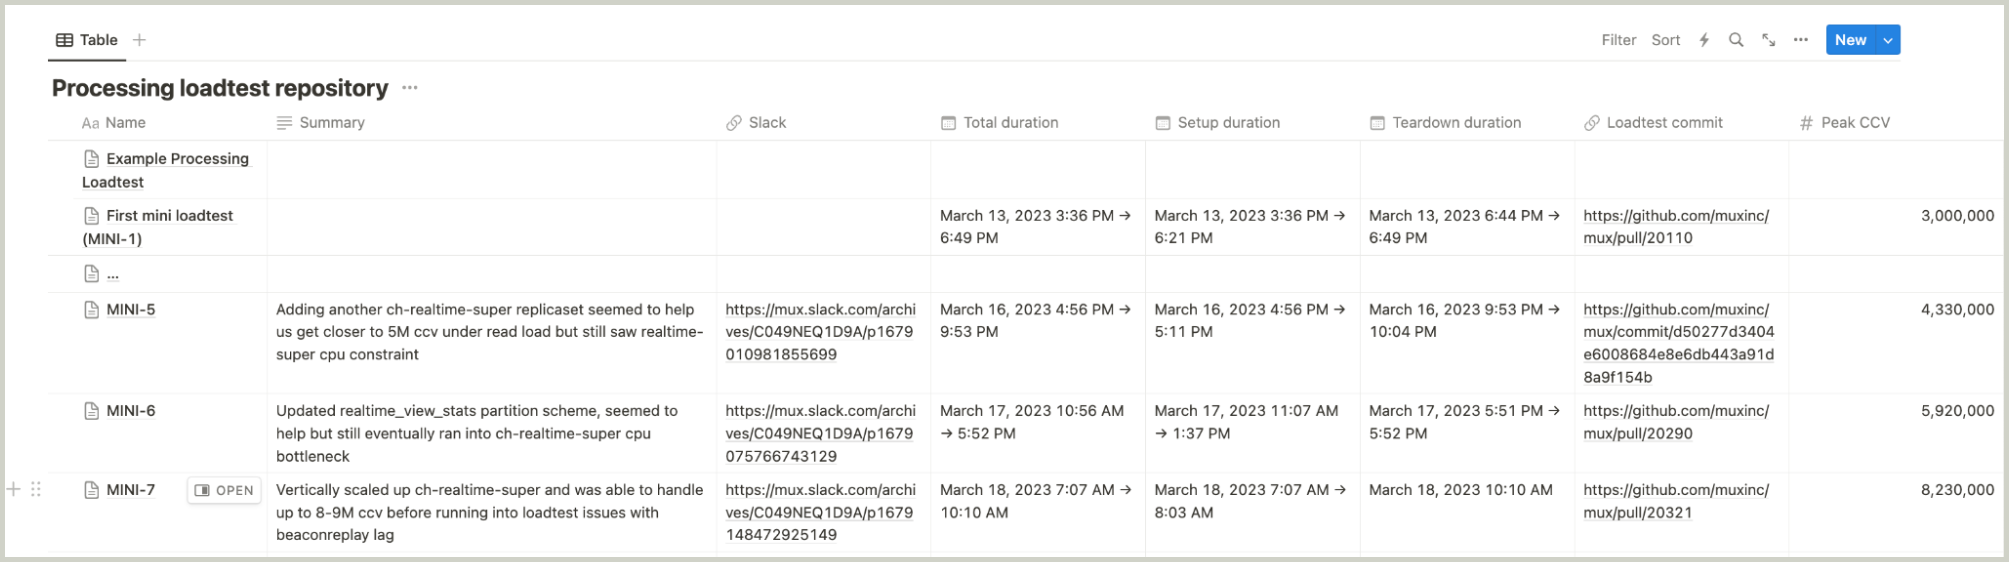
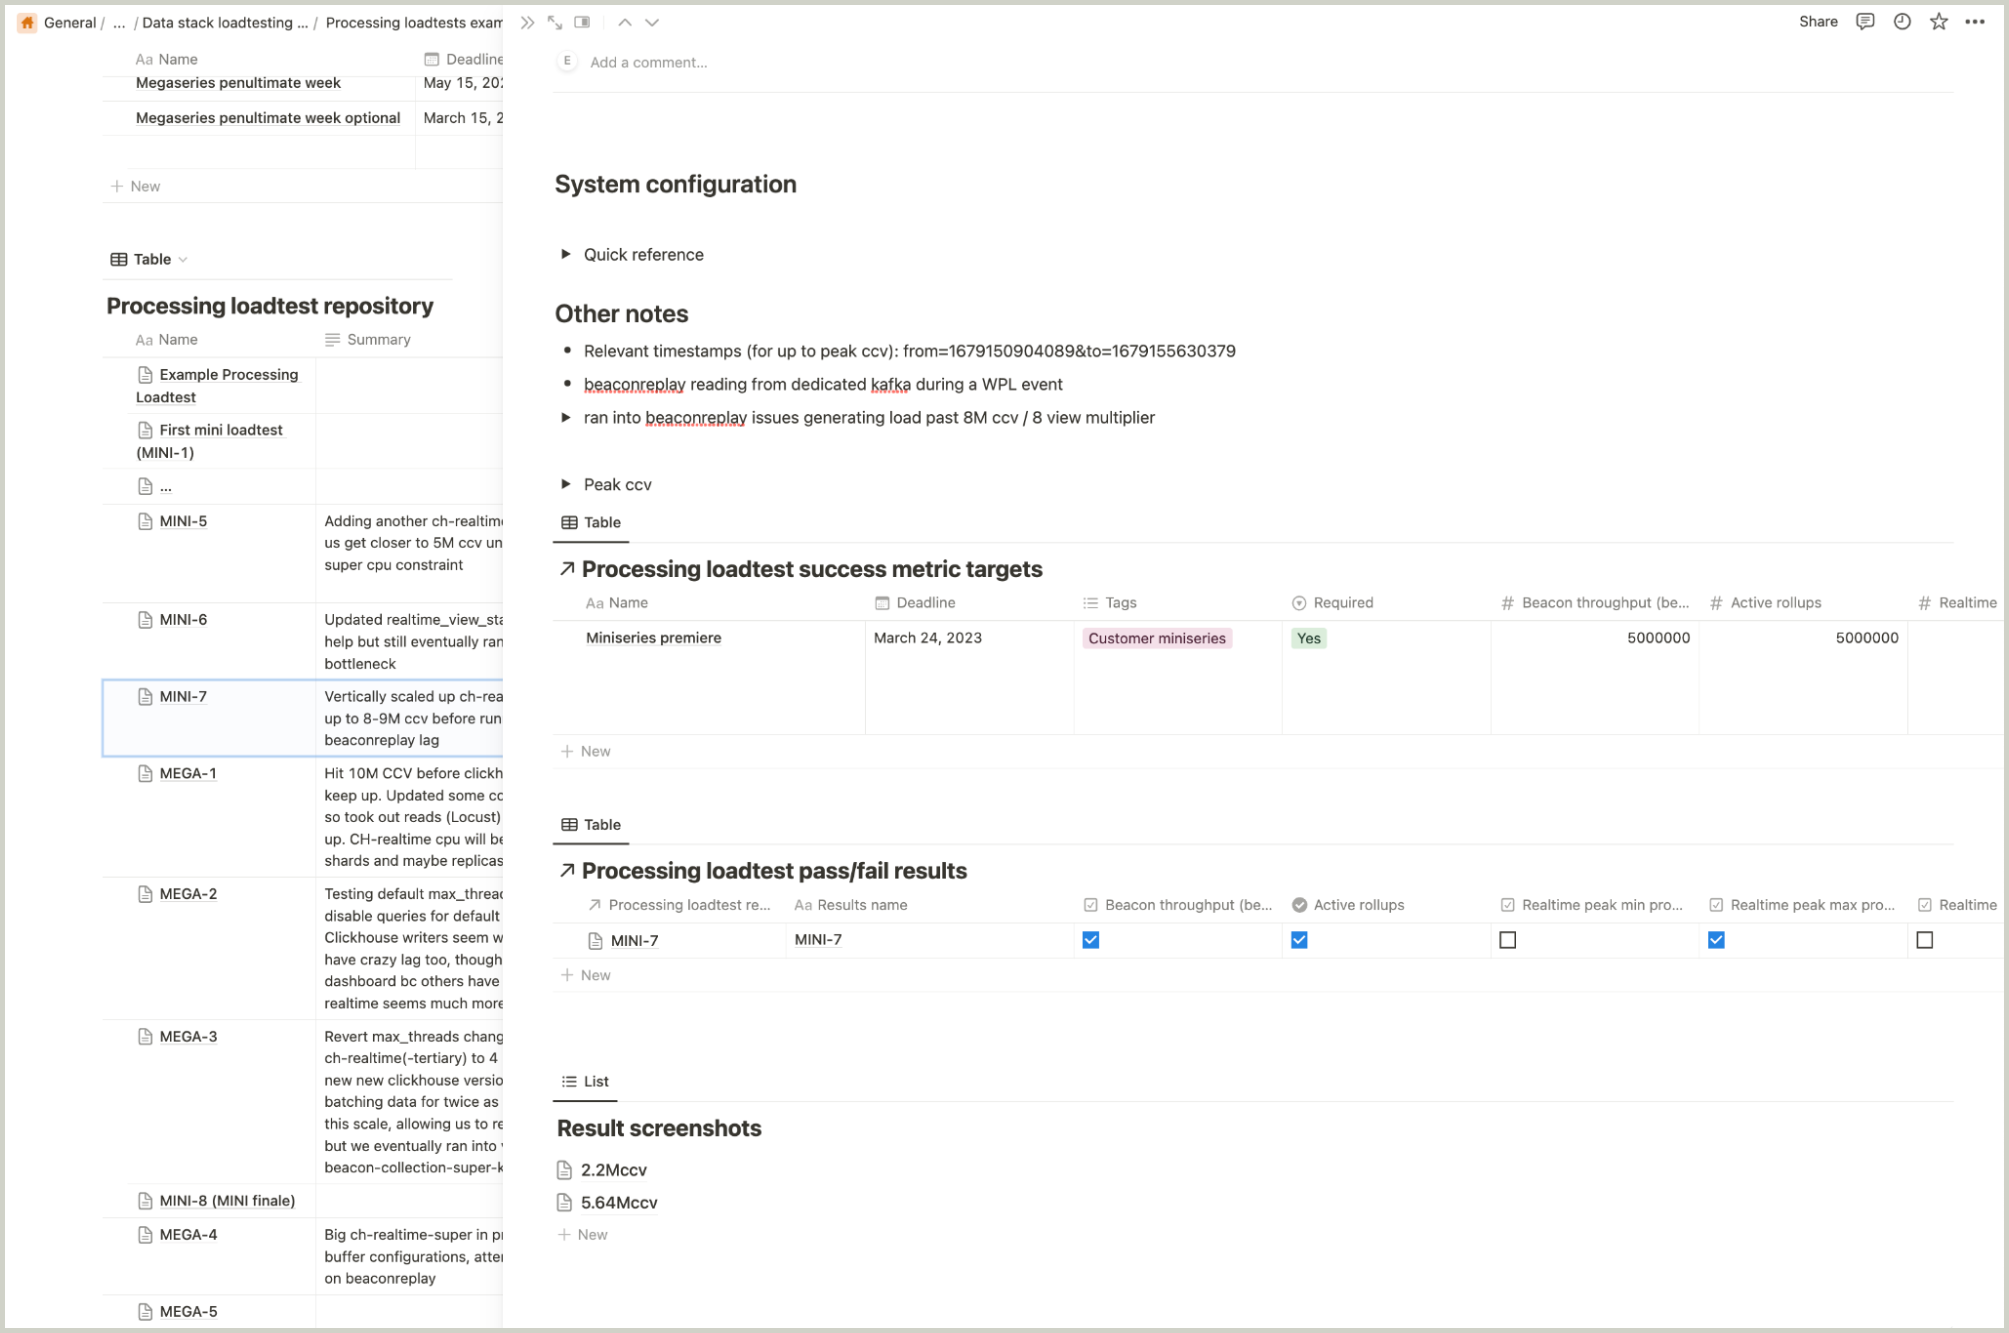
Though it wasn’t too fancy, it made a world of difference and added a level of rigor to help us track and reproduce load tests accurately. Even better, we could explore options for automatically capturing results of load tests using these predefined metrics in the future.
Getting to a repeatable process for spinning up our lab stack and tearing it down proved a little more challenging. We were missing some steps for bootstrapping our services, and overcoming these initial hurdles before we could even get tests running was costing us several hours. Furthermore, once the stack was up and running, we found we needed someone to observe system metrics almost constantly to identify any bottlenecks. By the time the lab stack was ready for load testing, it would be late in the day, and the team would be running on fumes.
Getting past this demoralizing low point required reassessing what our immediate goal was. Before we could focus on interpreting load test results, we had to cut down on the time needed to scale up the system in the first place. We blocked off another morning to go through the manual steps once more, making sure to add them to the scripts, and ran through just the process of spin-up and tear-down a few times until we had cut it down to half an hour to spin up all the services and ten minutes to scale everything back down.
When you can hear the seconds ticking away toward a hard deadline, it’s natural to feel eager to start generating outputs with actualizable insights. However, whenever we reached a roadblock, we had to step back and re-orient ourselves with the strategy we had laid out. What did we have to solve to get where we needed to go?
While keeping our eyes on the most urgent goals, we reminded ourselves to stay steadfast and methodical in re-identifying and tackling the obstacles that stood in the way. By investing a little time up front to establish an organized process for recording load test results, and by slashing the effort of spinning up and tearing down the lab stack to a few keystrokes, we could run as many load tests as the workday permitted and maximize our odds of success, while keeping system idle costs down.
Identifying our bottlenecks
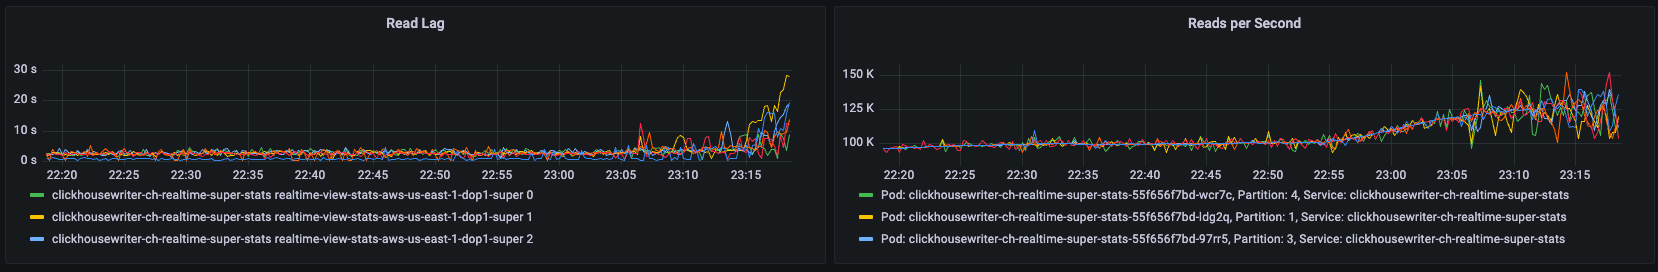
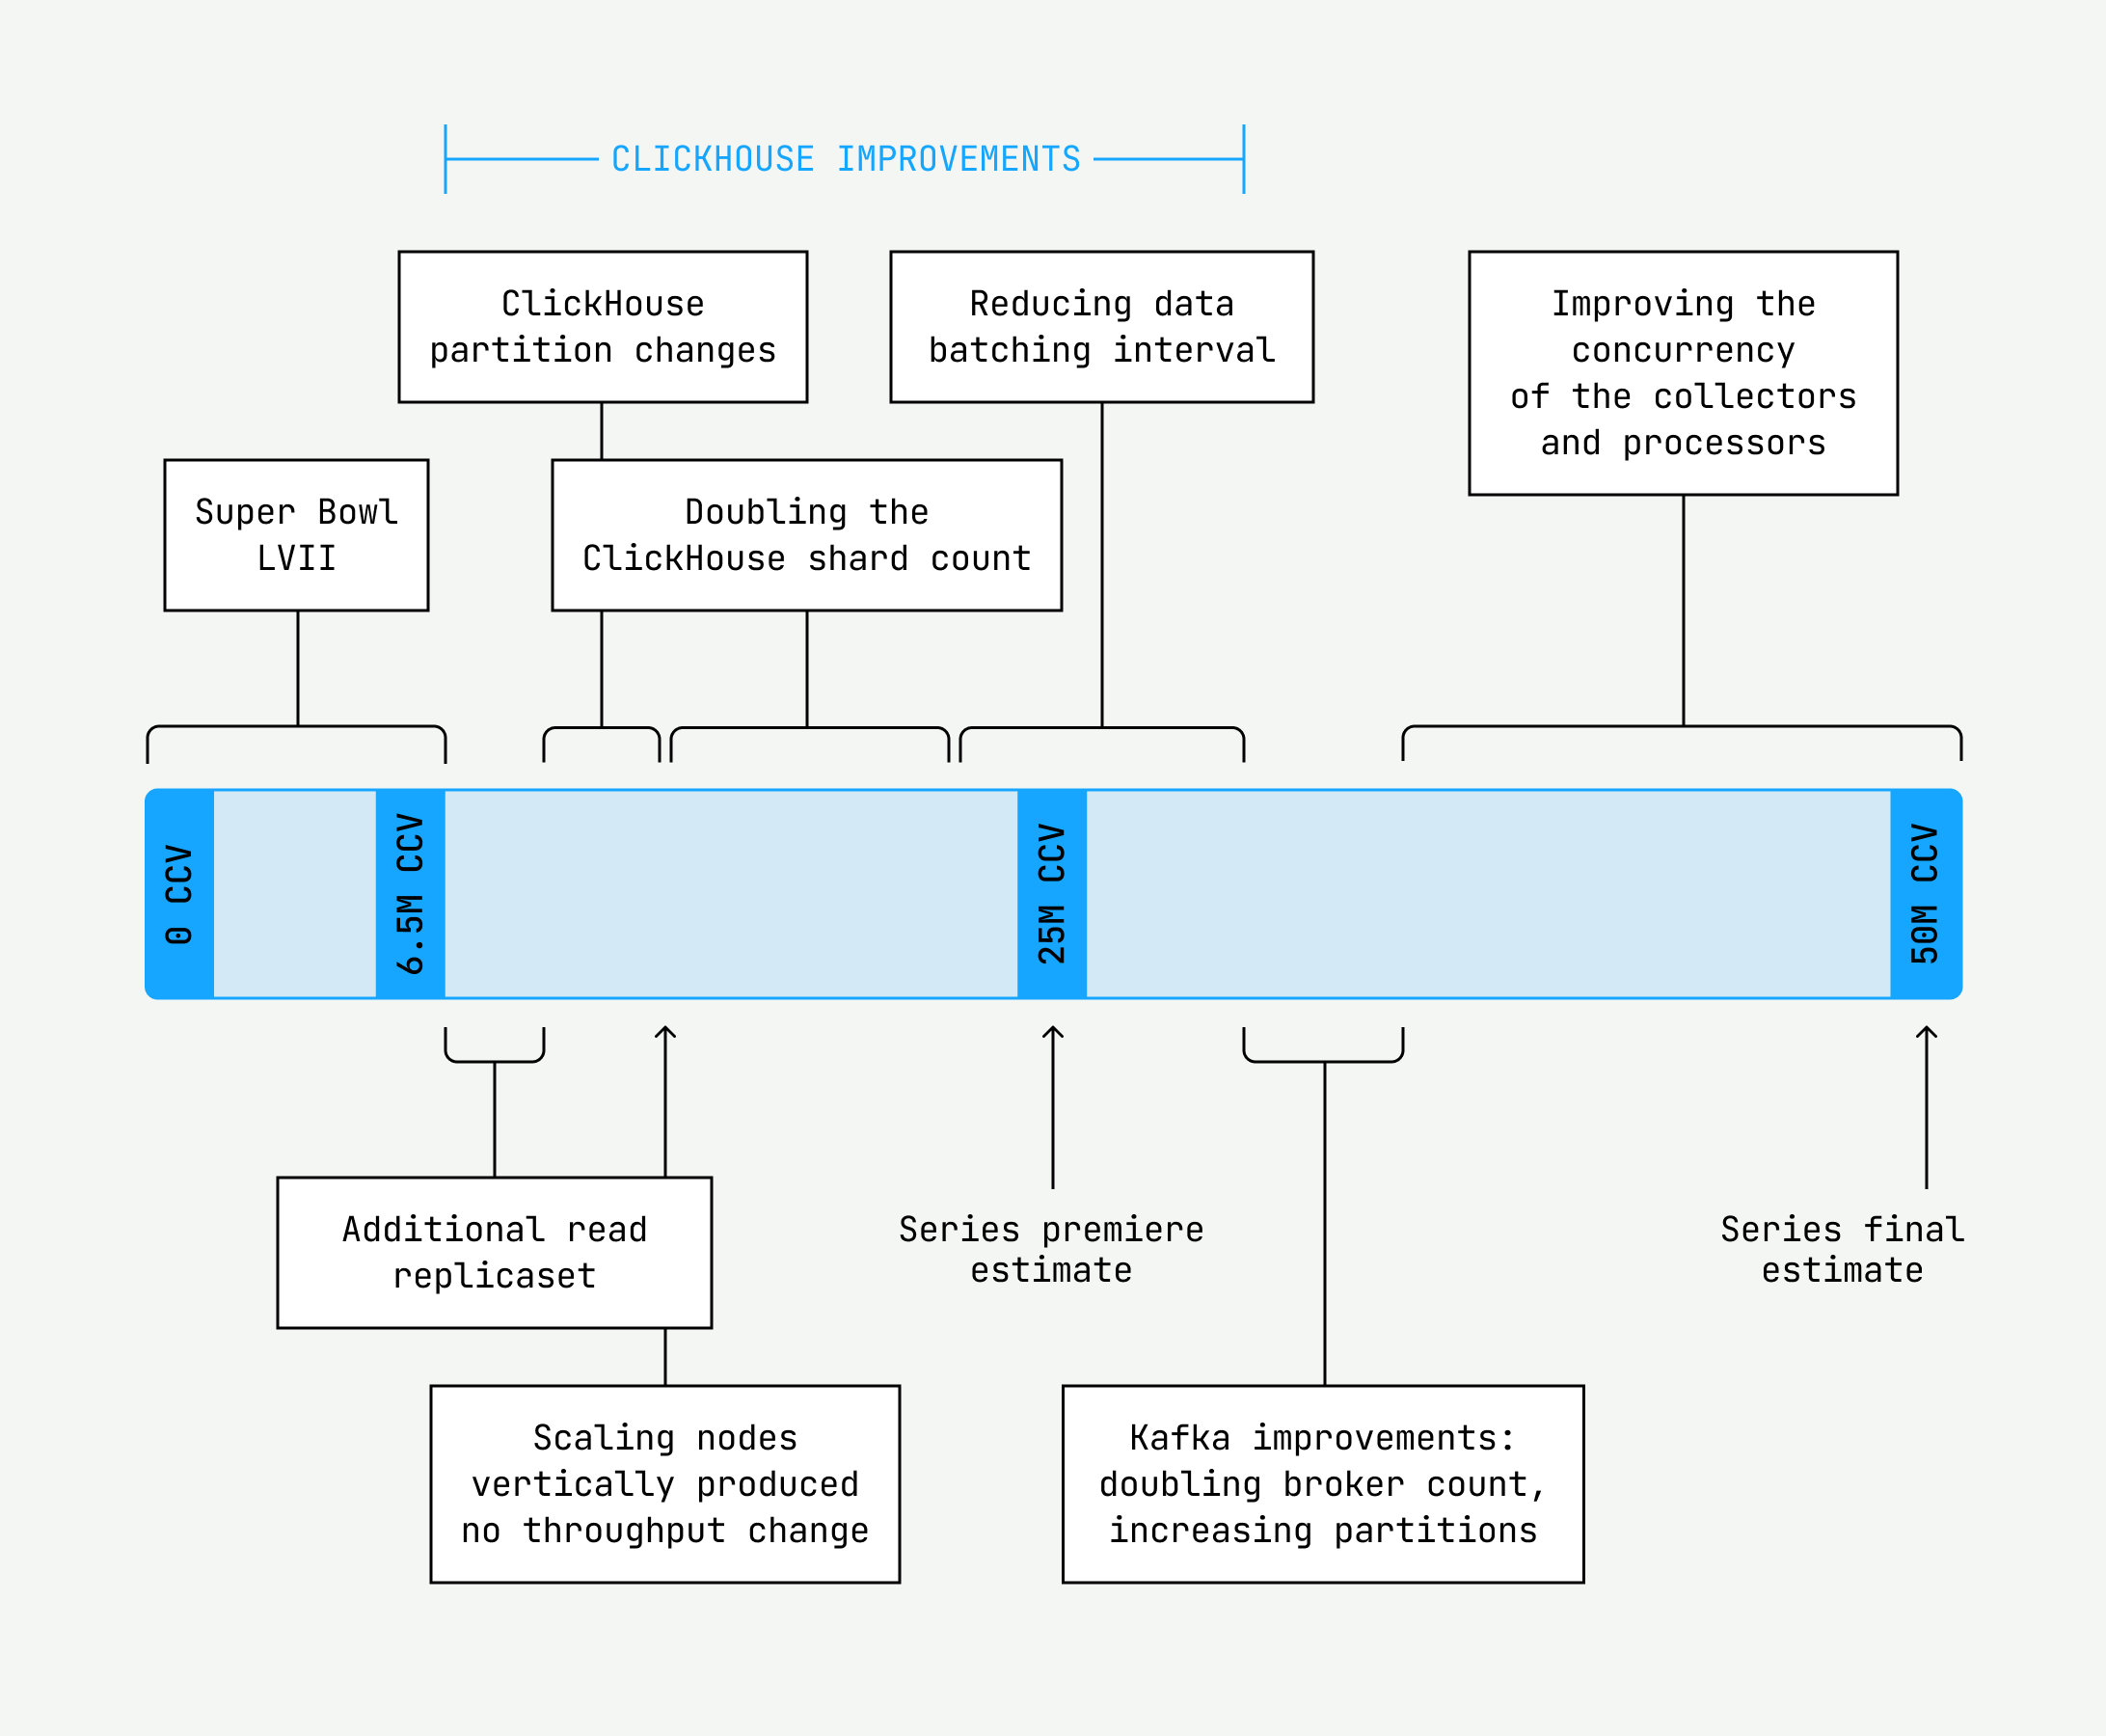
Once we solved that problem, it was time to identify our first bottleneck. We had a hunch our real-time monitoring database would be our first bottleneck, since we’ve had to take manual steps to scale it up during large events; it would get sluggish and struggle to serve queries in a timely manner. And we were right: This bottleneck showed up as elevated CPU for the database servers as well as increasing lag for the database writers before we even hit 5 million CCV.
Load testing was valuable in helping us scientifically vet changes to the monitoring database and their impact on the load we would handle. Over seven subsequent load tests, we tested the following:
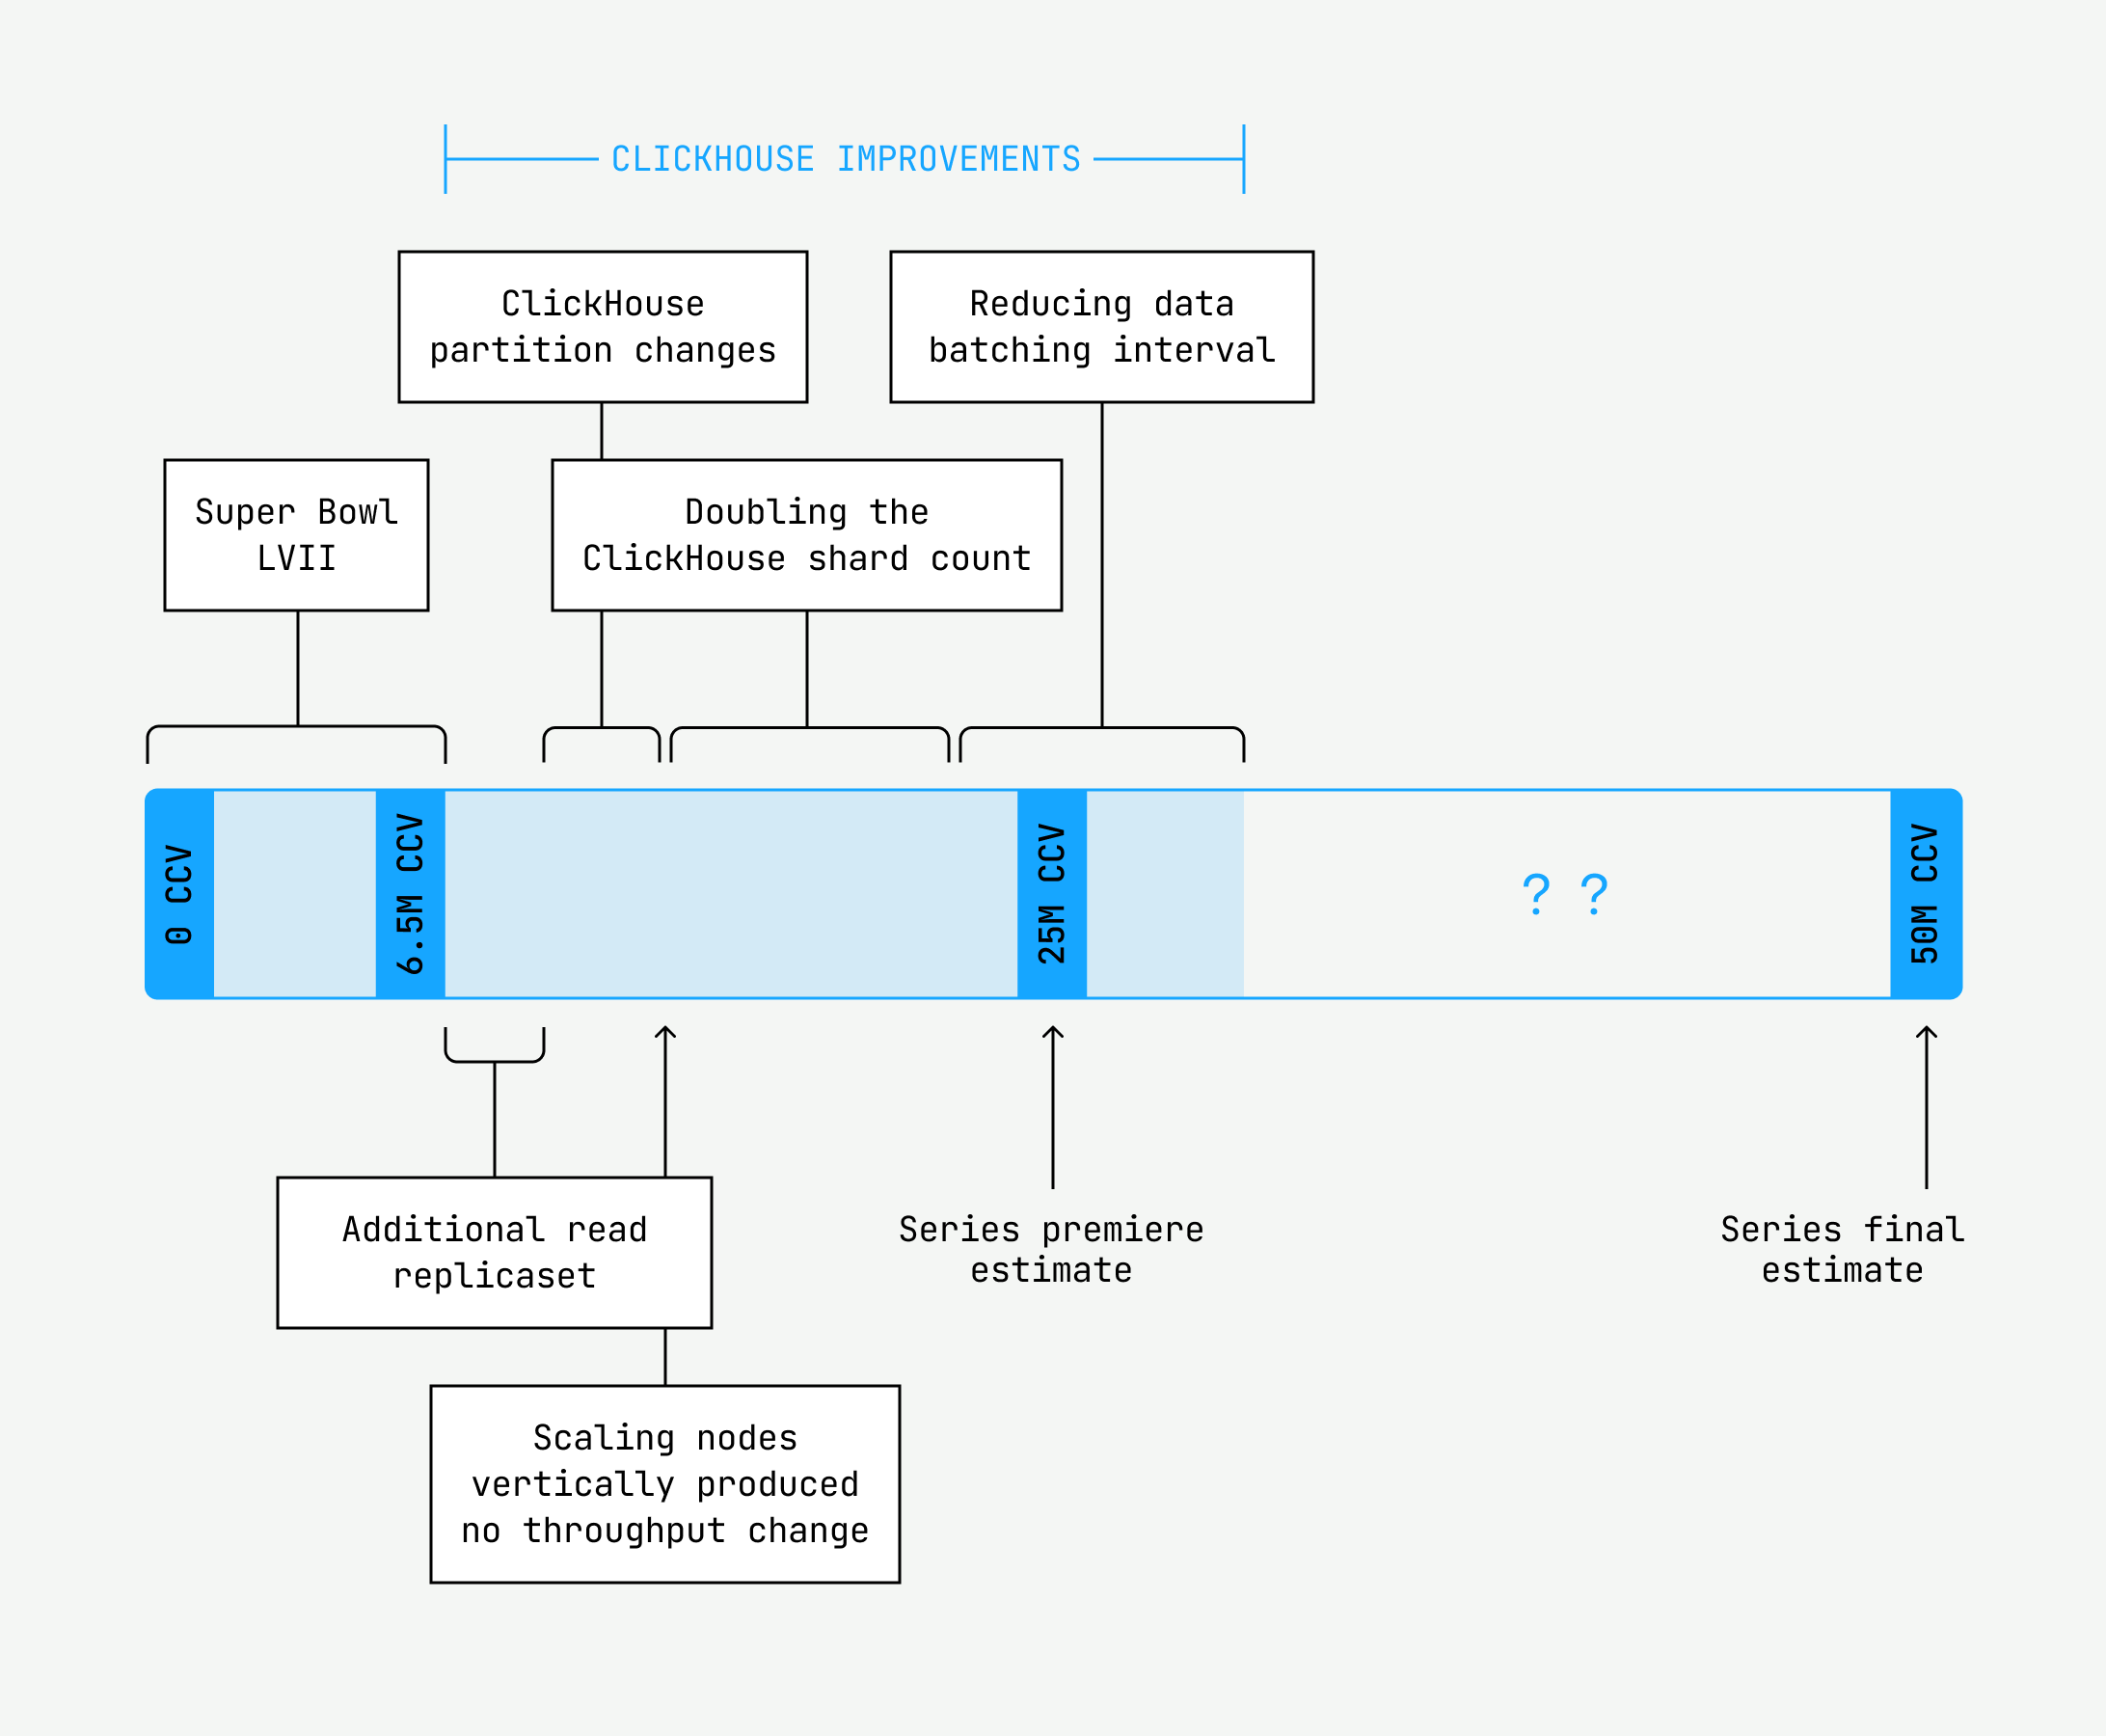
- Adding another set of read replicas to the monitoring database to balance read load
- Modifying the monitoring database table partition scheme to partition on more granular time intervals, resulting in smaller partitions
- Vertically scaling the monitoring database pods to maximize CPU and memory resources
- Lowering the max threads configuration for the ClickHouse database
- Horizontally scaling the database further by adding another replicaset for reads and increasing shards from 16 to 30 to decrease the amount of data per database shard and improve query performance
- Changing the data batching interval to reduce the amount of ingested data to more manageable levels
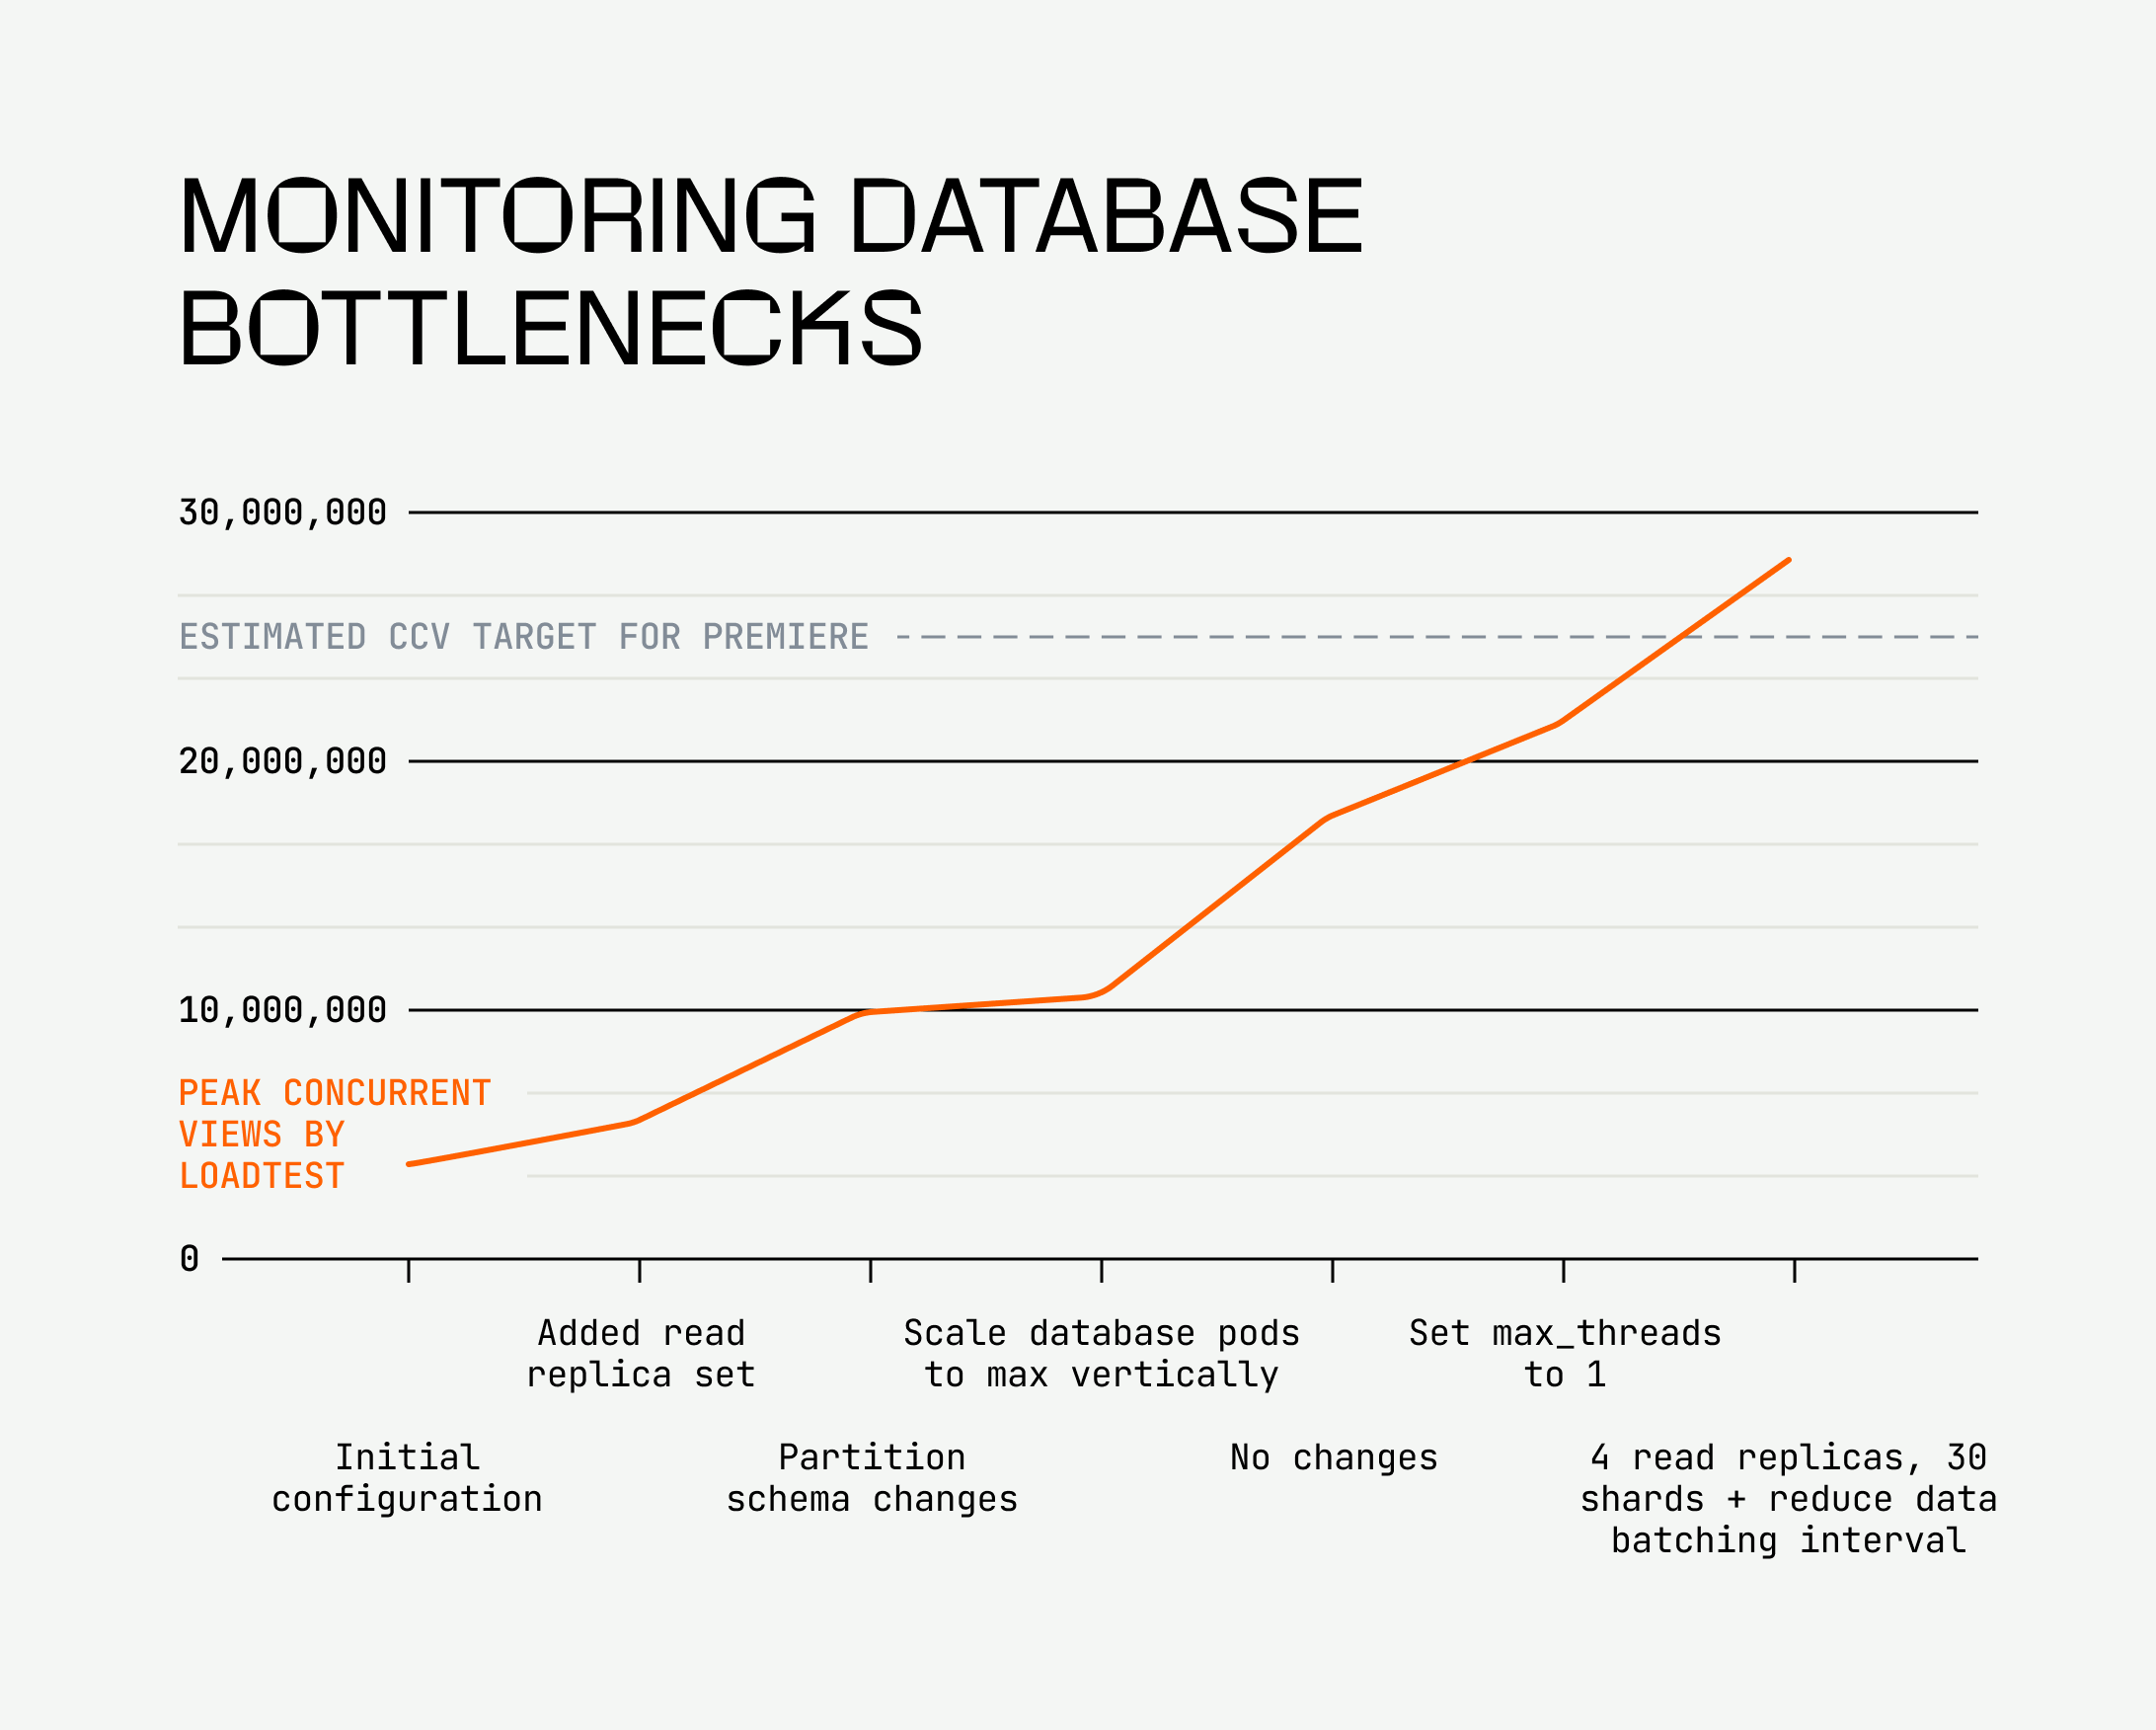
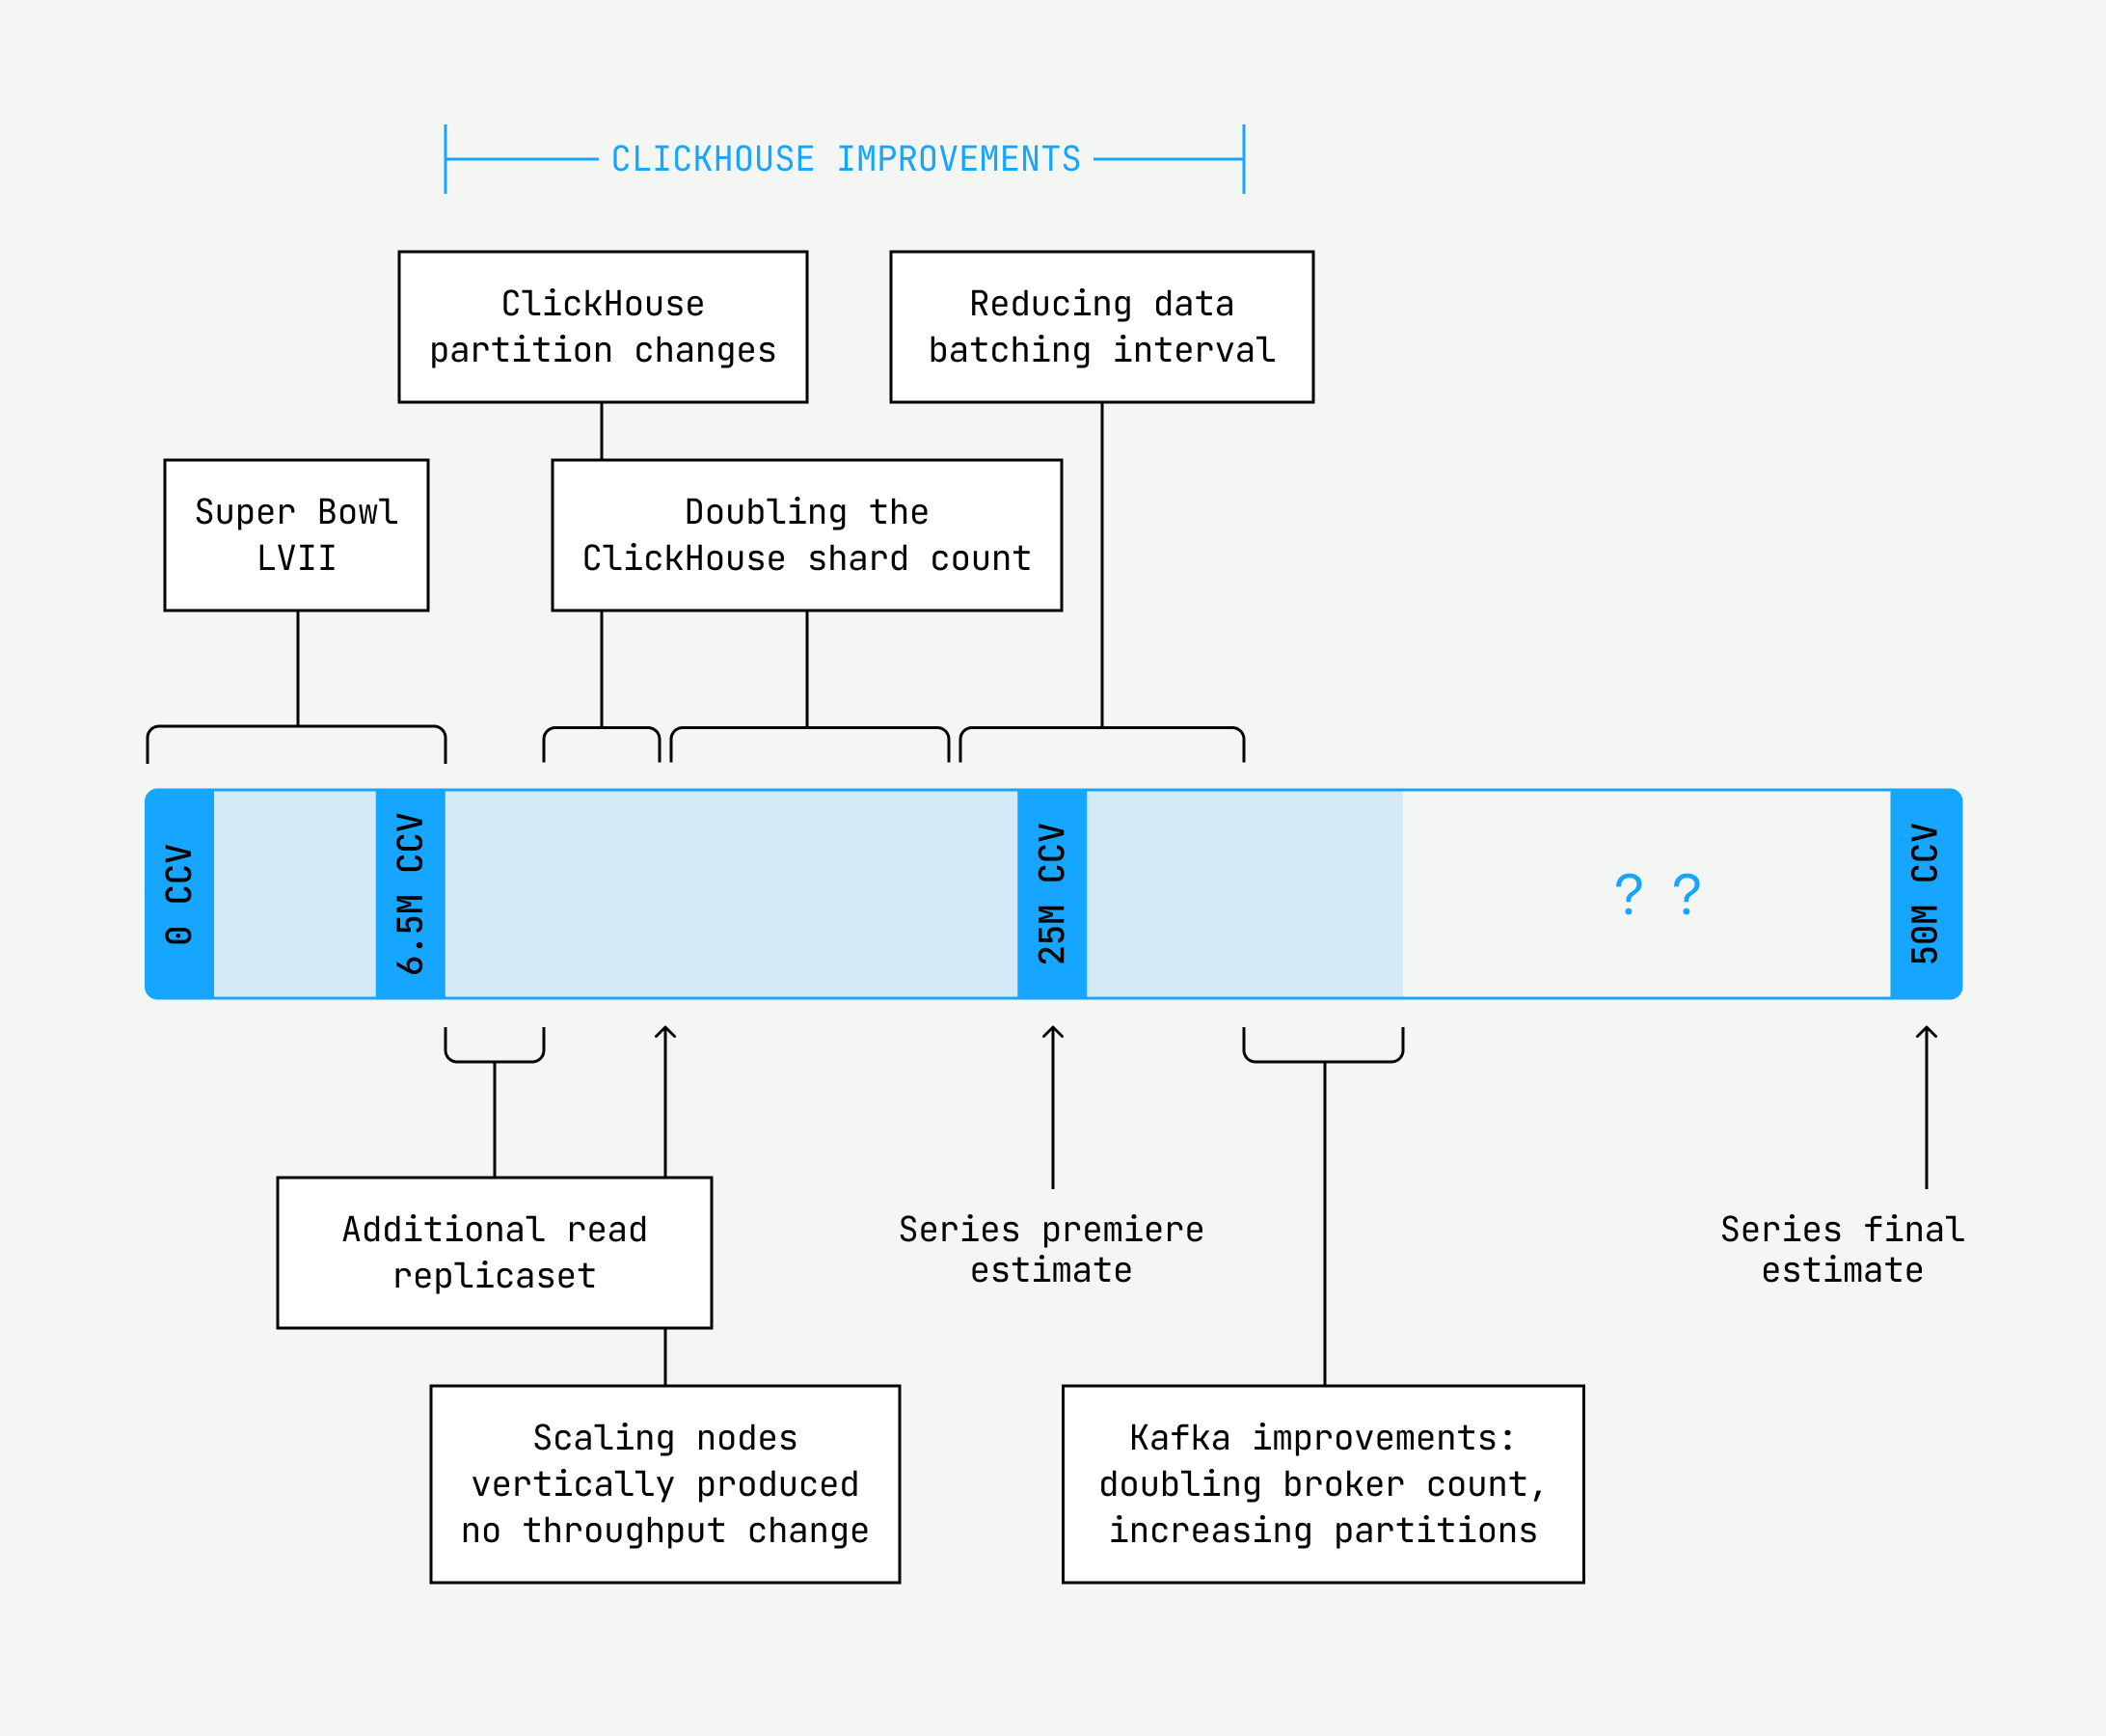
Finally, we had managed to successfully handle 28 million concurrent views with the configuration we had landed on, which was a welcome assurance for the initial events that were fast approaching with estimated high watermarks of 25 million concurrent views. But as for reaching 50 million concurrent views, we soon ran into our next undiagnosed bottleneck: lag at our beacon collection Kafka layer.
We use Kafka, a distributed event streaming application, as our message broker to forward heartbeats to our processing servers. There are a number of ways you can tune and scale Kafka, including optimizing the write volumes, tweaking Kafka’s producing and consuming settings, and increasing the number of brokers and partitions across which messages are distributed. We tried each of these in turn, but it was really doubling the brokers from 24 to 50 and increasing partitions from 600 to 960 that had a meaningful impact on the scale our system could handle.
At this point, we had prepared most of our processing pipeline for workloads of up to 32 million CCV with some headroom to spare. We felt ready for the initial events, which had lower load estimates than the finals. However, our testing so far had excluded a crucial piece of infrastructure: our collection edge layer, a.k.a. the collectors. With just a few days until the events premiered, we had to vet the collectors using a separate load testing tool. We determined that we needed to spread our collector servers out across three separate availability zones so they would not run out of the IPs necessary to handle 32 million CCV as well.
After a mad flurry of activity and no small amount of hand-wringing for those first few nights, we successfully handled the first events with a high watermark of 15.7 million CCV. What a relief!
But our work was not done.
The final push
Our crucial edge service, the data collectors, couldn’t scale enough for the projected 50 million viewers for the final few events. At our current horizontal scale, we could only achieve 30 million — nowhere near good enough. Then, we calculated that we’d need more than 3500 collectors to support the finals…yikes. AWS didn’t even have that many of the four core machines we wanted to provision. Not to mention we would need to reconfigure our IPs before we could scale to that level. Therefore, we had to scale vertically. Yet, when we gave them additional CPU and ran a heavy load through, the collectors wouldn’t utilize more than three cores. Reconfiguring the parameters didn’t help, either. It was time to hedge our bets: Roll up our sleeves, dive into the code, and find the CPU bottleneck before the finals, while also preparing to scale 3500 collectors.
The code bet won. The problem, unsurprisingly, was collector concurrency.
Inside a collector, a server listens for SDK heartbeats and puts them into a Golang channel. Consuming from the channel was a lonesome Kafka producer: our bottleneck. When the server put heartbeats in the channel faster than the producer thread consumed from the channel, we would hit our max throughput. The channel eventually filled up, and the server began rejecting heartbeats. It was a bad time.
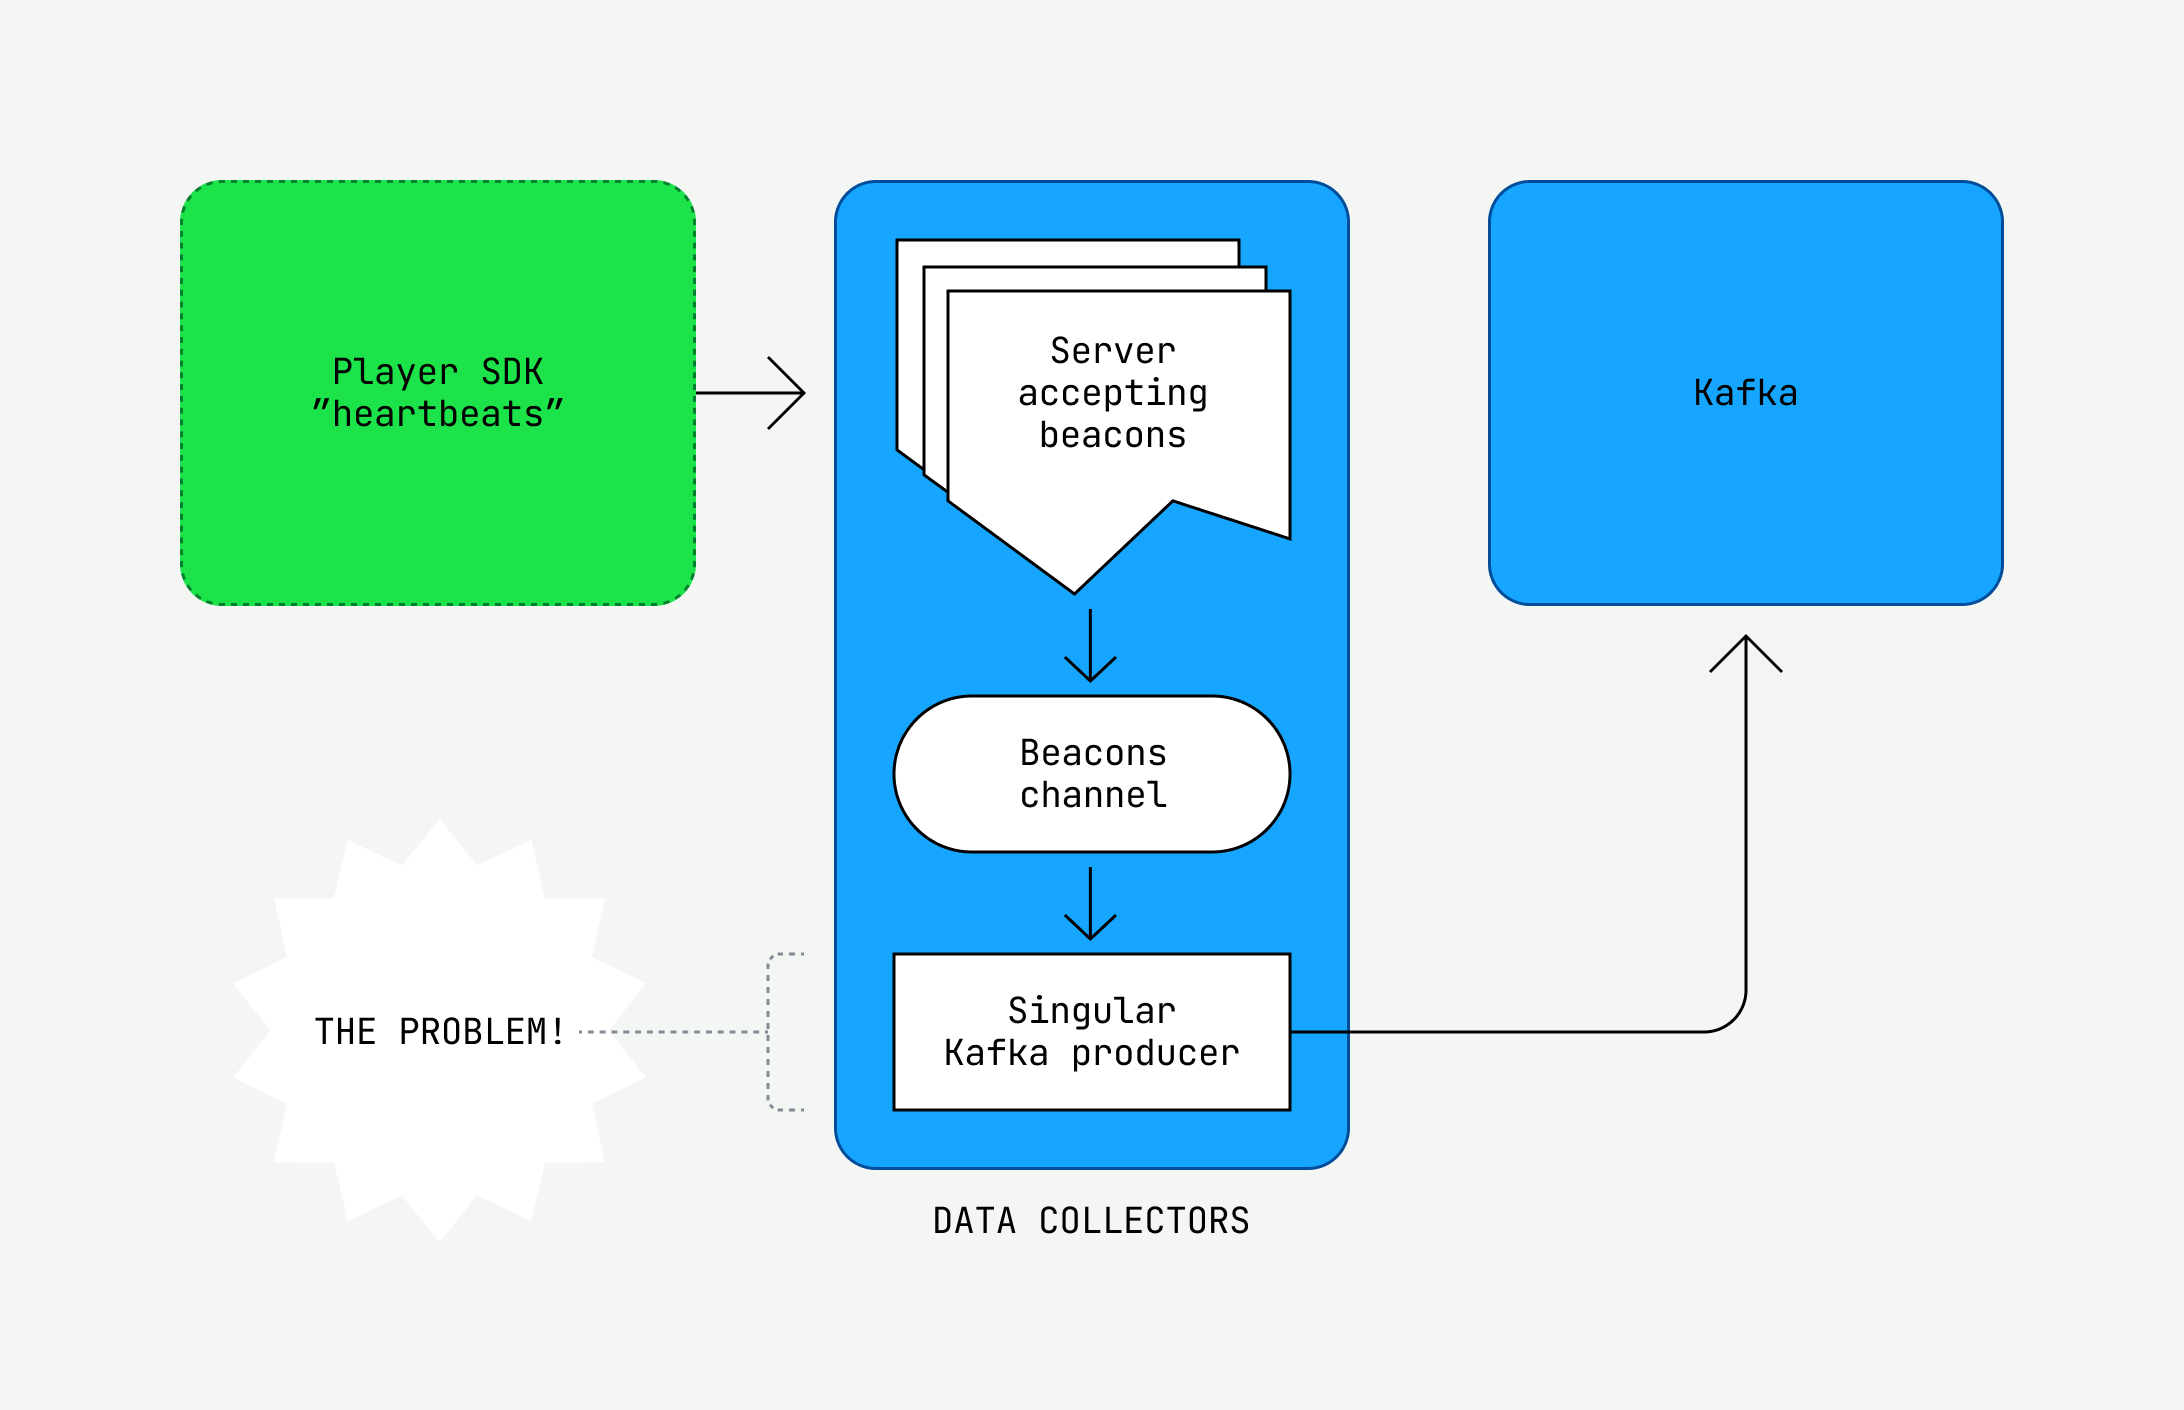
Luckily, when we increased the number of threads and ran a load test, we finally got some results. What’s more, we could extrapolate this technique to improve our processors as well. At last, we had cleared the final bottleneck. We had achieved a load test for 50 million CCV!
We scrapped the preparation work for 3500 collectors, shipped the thread change, quadrupled the cores of the collector nodes, calculated the amount of prescaling we needed, ran through our runbooks one last time, and waited for the finals. Numerous issues could potentially arise, but we felt confident. After a total of 18 load tests with various tools, charts, and configurations, we felt as if we had seen it all. And those finals, well, they were uneventful. Almost a letdown, even, as our system recorded only a bit more than 30 million CCV at its peak.
Looking back and moving forward
Nonetheless, the team achieved numerous system improvements throughout the series by load testing. We managed to overcome the time pressure, combat the operational burden, and scale to an unprecedented level. We made substantial improvements in our ClickHouse database layer, intermediate Kafka storage, and the scale of our Golang applications. Moreover, as we emerged from those two months of uncertainty, we were confident that we had set ourselves up for the future. Load testing equipped us with a repository of application configurations for any scale as well as a comprehensive suite of alerts and runbooks.
Of course, it wasn’t all sunshine and rainbows. The cost of some infrastructure seemed unnecessarily high, and we had to slowly phase out the shortcuts we’d taken once the events were over. There’s always work to be done. But by and large, our team can proudly claim that we turned a pending system scale disaster into a massive success.