There are literally millions of combinations of characteristics that can cause video experiences to break. An error can happen to only viewers on a web player, hosted in a specific browser, or on a live stream delivered from a single CDN, just to name a few. It’s part of the challenge - and frankly - the fun of this industry we’re in.
To find and resolve these issues, Mux Data users need a level of reporting flexibility that matches the complexity of the issues they are trying to resolve. Mux customers want to dig deeper into their video experience data and to make it easier to correlate issues across different metrics and types of reports. In order to help our customers be more efficient across Mux Data reports, we have improved the filtering capabilities and changed some page behavior when filters are applied.
Filter always in view
Our users spend a lot of time looking at metrics, debugging issues, and researching areas where to focus improvement. We wanted to help and continue to make the metrics reporting experience more efficient.
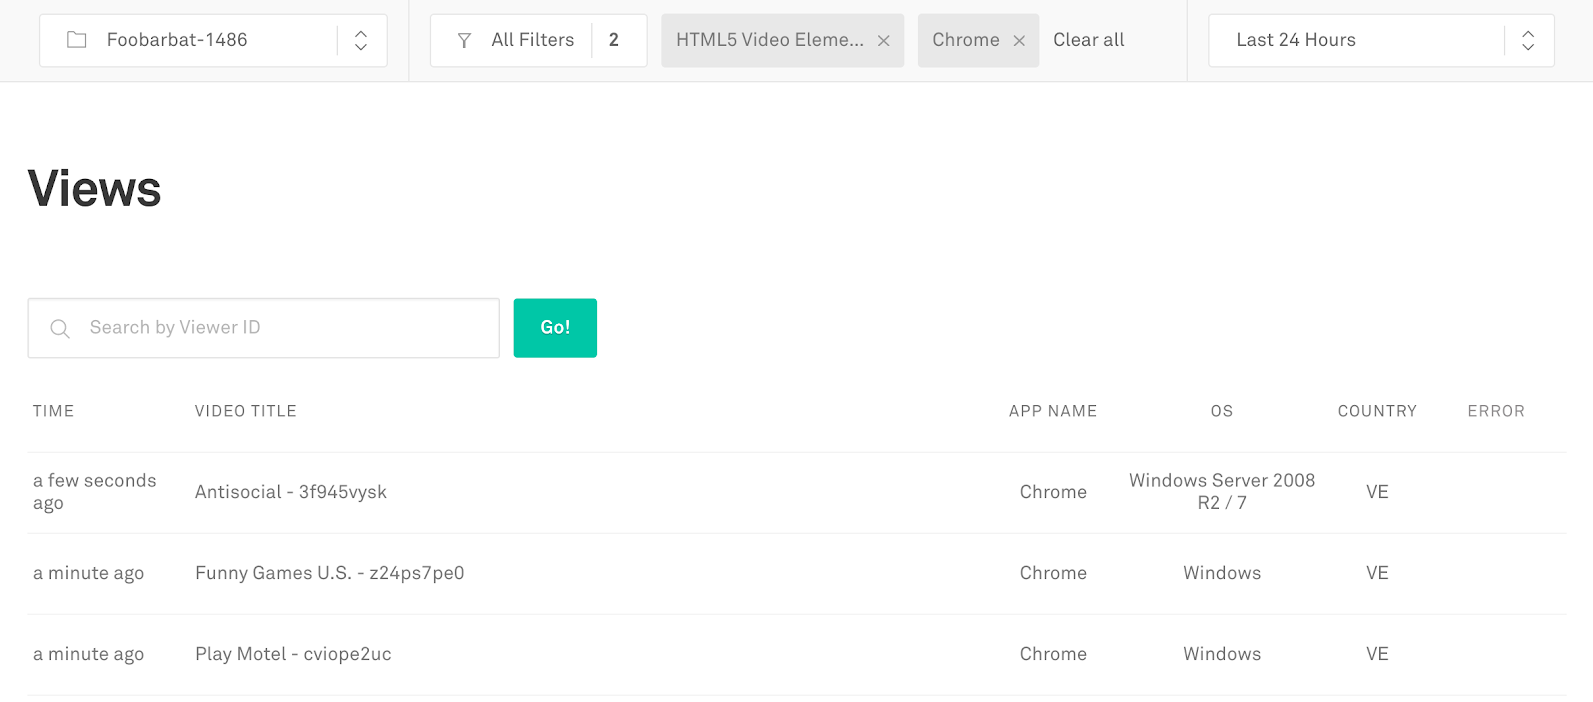
We have moved access to the filters from a button above the list of metrics to a common toolbar at the top of each page. From here you can easily change the current environment, add/change/remove filters, and update the time interval for the charts and breakdown tables.
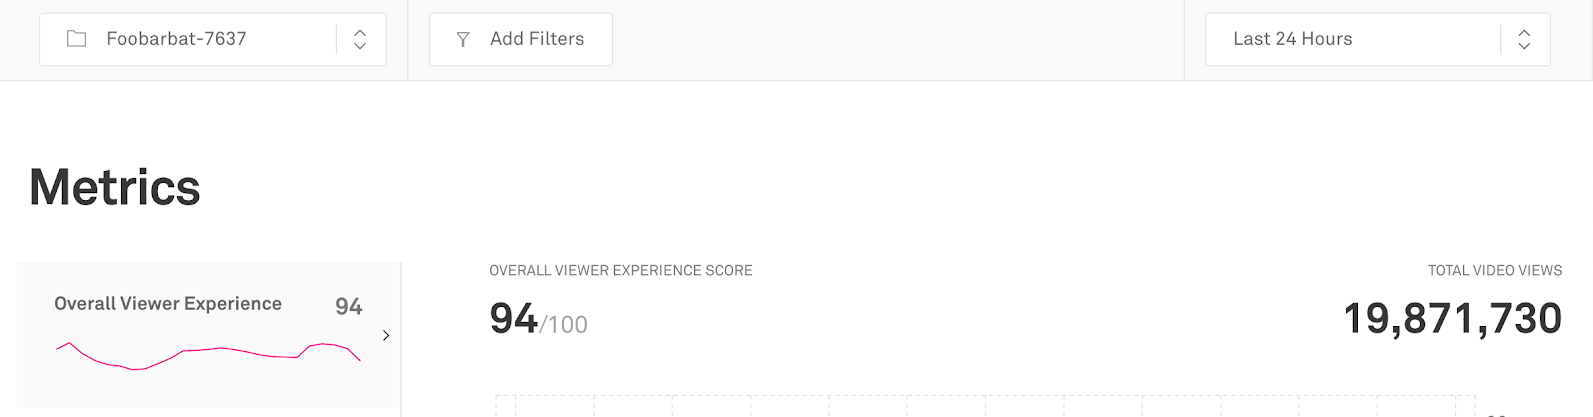
As you scroll down the page to look at the Breakdown charts, the filter bar will be pinned to the top of the page to make it easier to remember exactly which filters are applied to the current page.
Dig deeper with higher filter limits, OR, Exclude
Video experience problems often occur for specific combinations of devices and delivery platforms, such as VOD content on an older player served from a specific CDN. Tracking down issues like this requires the ability to filter on many different characteristics at the same time.
To make occurrences such as these easier to find and pinpoint, we have expanded the filtering capabilities in Mux Data.
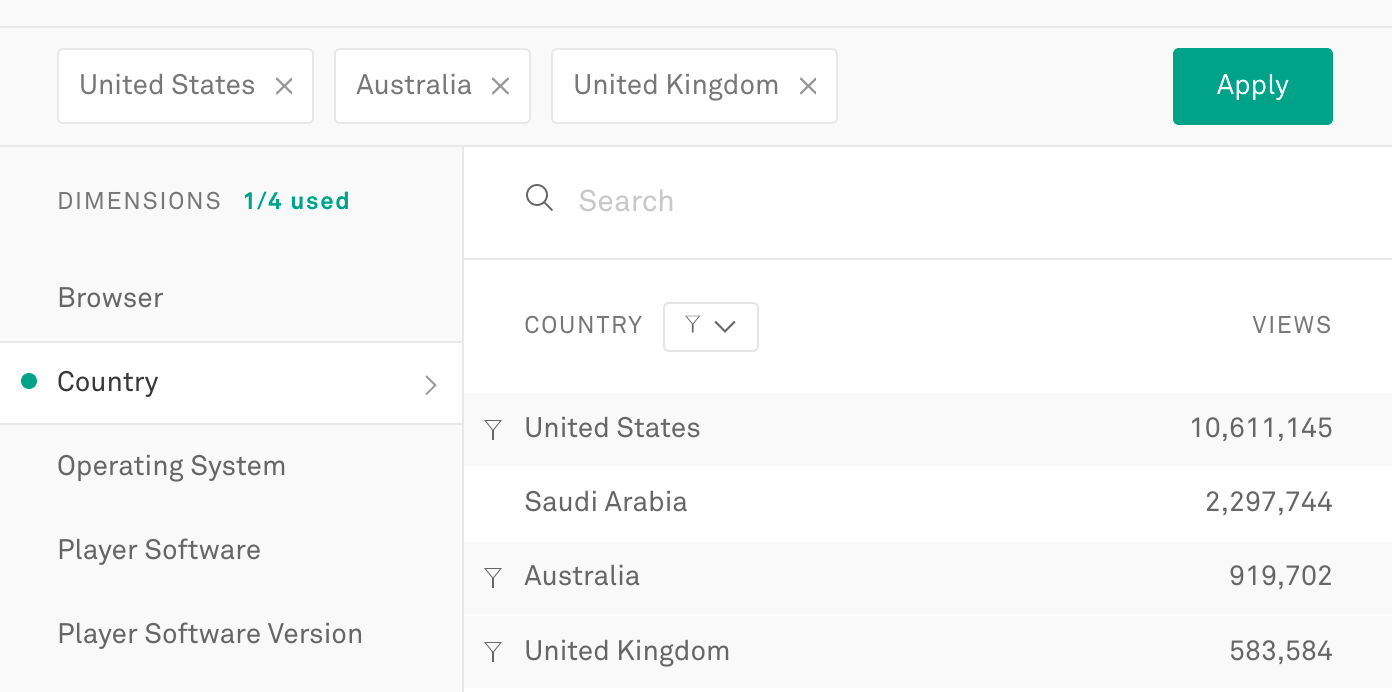
We have significantly increased the number of filters that can be applied to a query. First, for customers with a Media plan, we’ve increased the number of dimensions that can be used together in historical metrics reporting from 2 to 4.
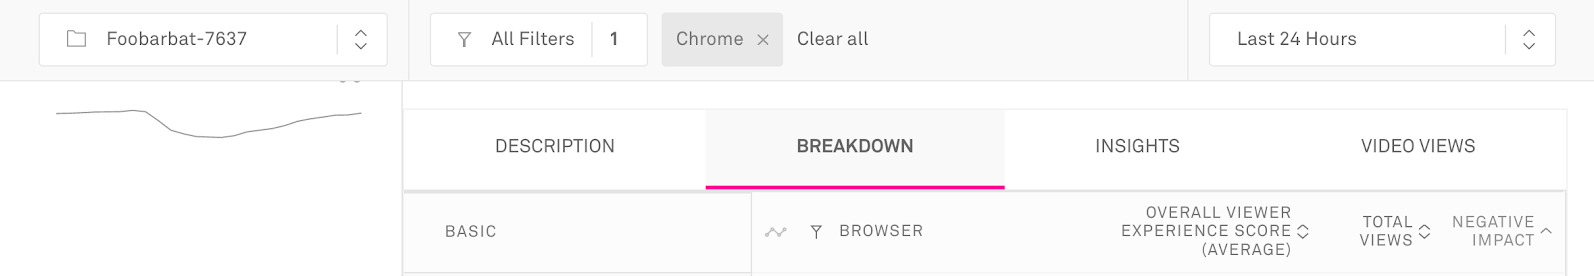
In addition, within a dimension, you can select multiple filter values that will be applied as an OR query. For example, if you select multiple countries, views from any of the countries selected will be included in the query. Multiple filter values selected within a dimension will only count as one dimension for query limits.
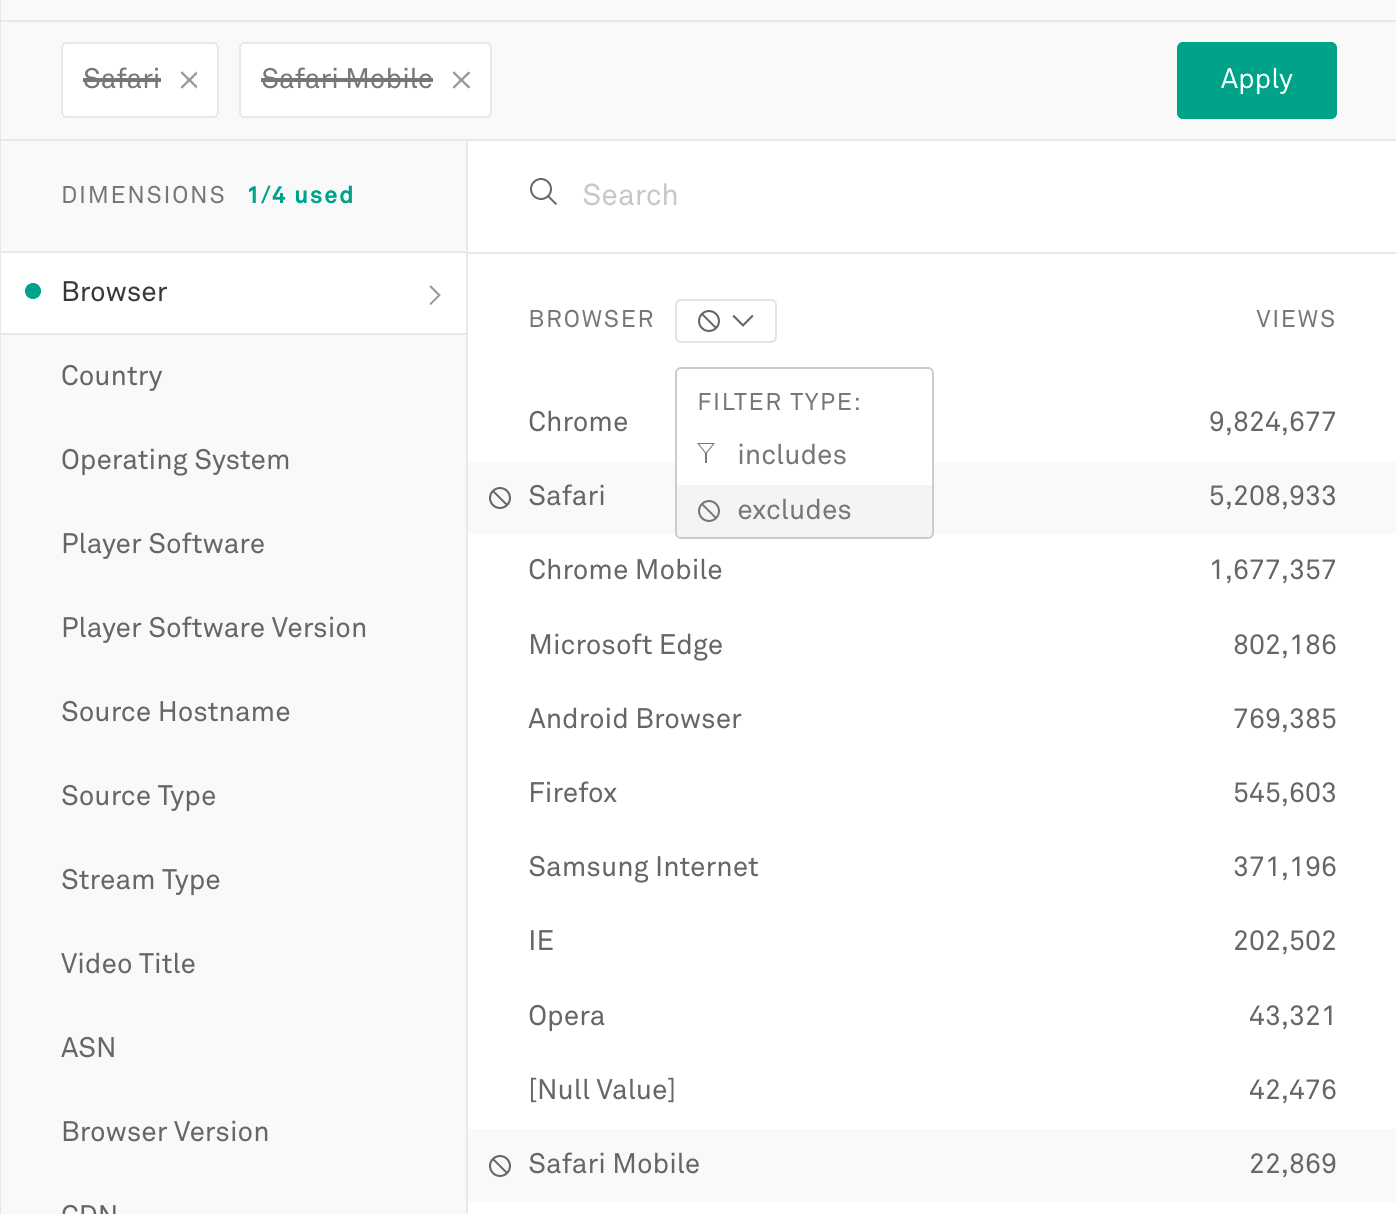
We have also added the ability to exclude selected values from a query. Values in a dimension can be excluded from the results by changing the filter type in the dimension to “excludes”. Values that are excluded are shown with a strikethrough on the name in the filter dialog and filter bar display.
All of this together means, for example, you could apply filters to find errors for live video viewed on recent versions of Roku served from Fastly in countries outside of the United States.
Investigate performance across metrics more easily with persistent filters
The biggest behavioral change in the new release is how filters are applied when changing metrics or viewing other types of data.
Customers will often start with a specific metric and build a filter that helps highlight an issue. They then want to view a different metric or switch to Alerts or Errors with the same filter values applied to help them understand the full impact of a problem.
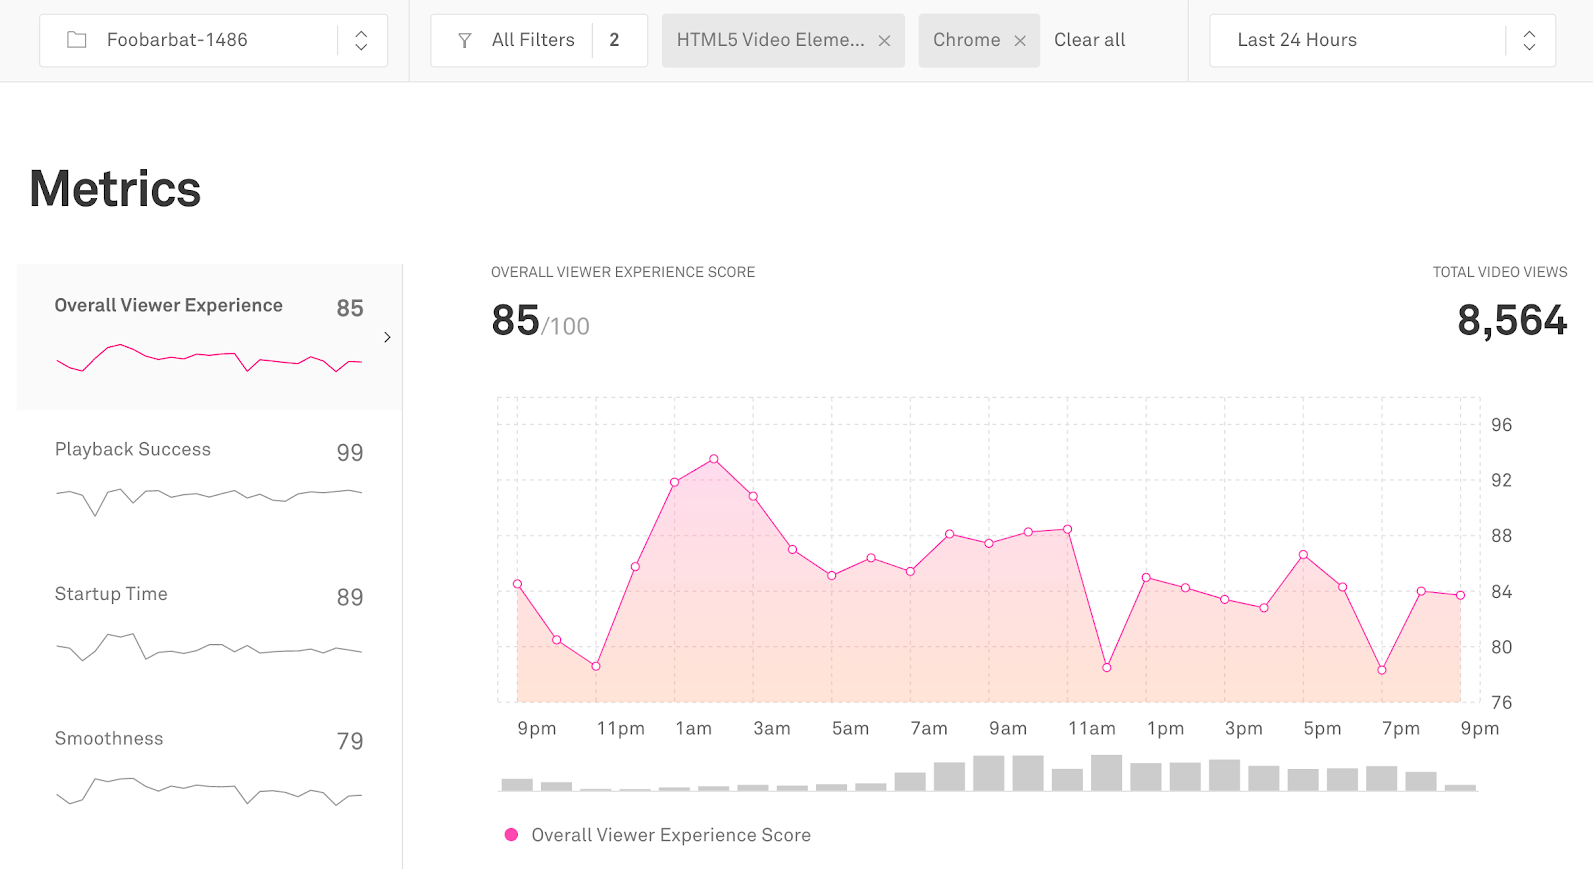
To better support this use case, we have made the filter bar persistent when changing the metric.
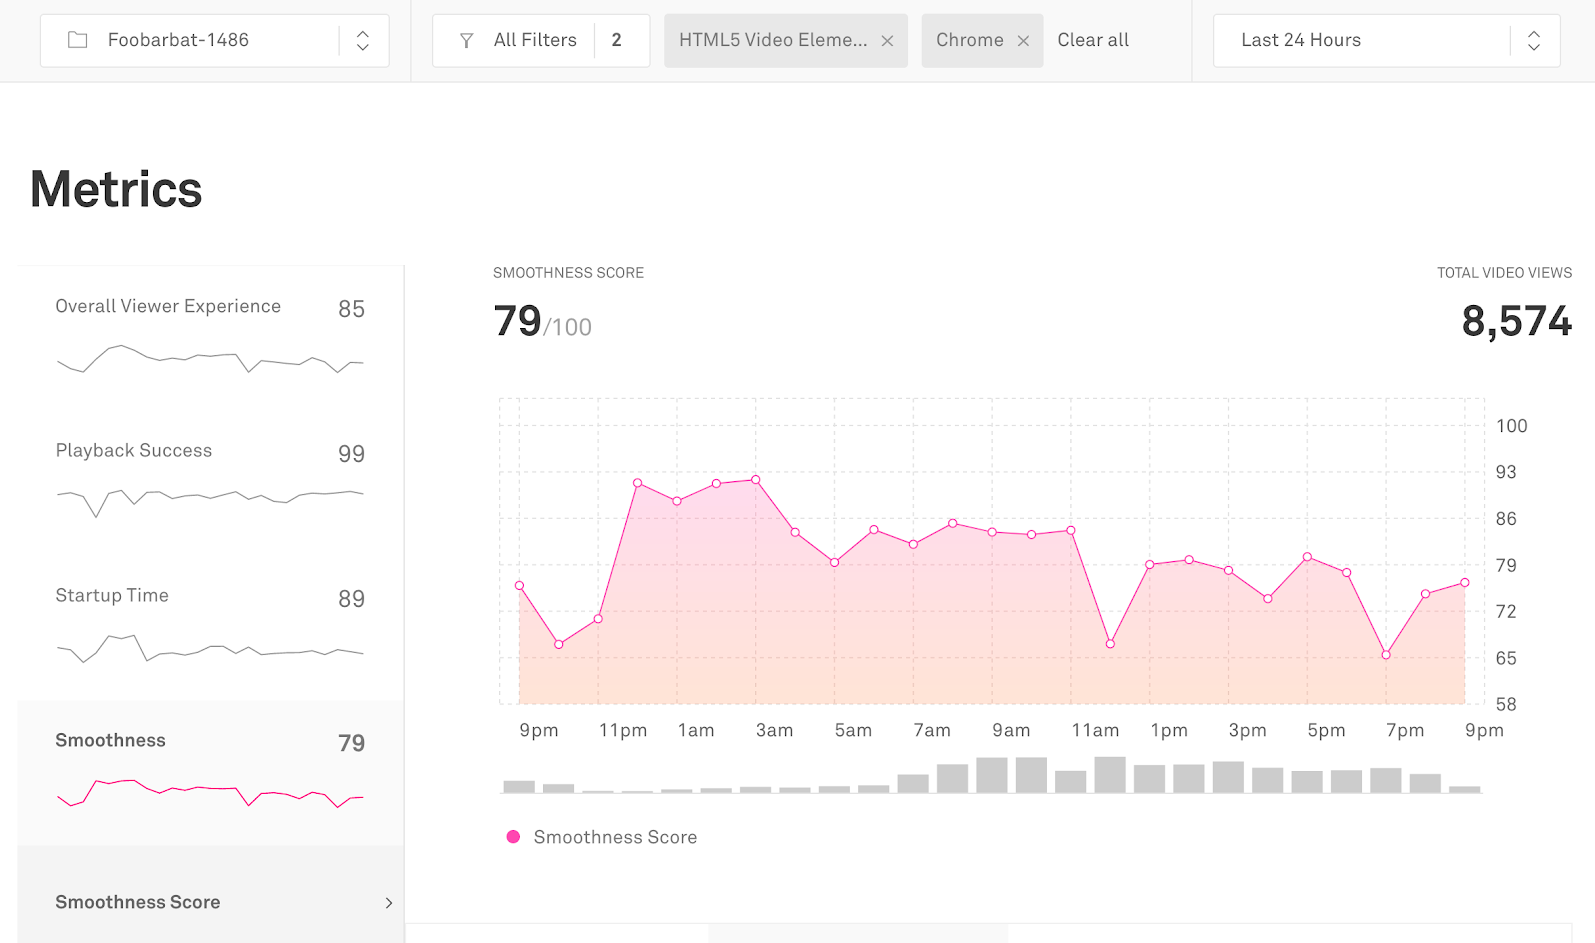
For example, if you configure a filter while viewing the Overall Viewing Experience score and then directly navigate to Smoothness Score, the filter will be preserved when loading the new page for Smoothness Score.
We will also preserve the filter across related sections in the Dashboard. If you set a filter while viewing the Metrics, Views, or Errors, you can click between the sections and the filter will be preserved. This change makes it easier to find the views or errors that make up the metrics in the charts.
We're rolling these new filter features out to customers over the next few days so keep an eye for it in your Dashboard. We hope these advanced filtering capabilities help you be more efficient as you monitor and solve complex streaming issues. As always, let us know your thoughts on this feature and any other product suggestions.