
Updated 9/23/2026: Playing time by rendition is now available via API as well as in the dashboard. Learn more in our guide
Your viewers’ device types, available bandwidth, and network congestion all affect which renditions are delivered during a playback session. A viewer on a fast connection might stay in 4K the whole time; another on a congested network might spend most of the session in 720p without ever noticing.
If you're tracking quality of experience or efficiency goals, you need to know which renditions your viewers are receiving, not just what your encoding ladder makes available. Playing time by rendition helps you you see that consumption directly, so you can tell when a rendition is delivered more or less often, or when encoding changes or resolution limits might improve outcomes.
Players know what renditions were delivered
Adaptive bitrate streaming (ABR) exists because viewers watch in a wide range of conditions: on computers connected to high-speed networks, on phones with congested cellular service during a subway commute, and on living room TVs. ABR lets each client request the best-suited rendition for its conditions, segment by segment. The logic that makes that call lives in the player, and every player weighs it a little differently based on its own goals and context.
Whether you're a Mux Video customer or you are using your own video infrastructure and manage your own ABR ladder, only the player knows what was actually delivered in a given session. It reports rendition changes along with per-segment bitrate, frame rate, codec, width, and height. Mux Player and the Mux Data SDKs already support collecting these rendition metrics at a sub-view granularity; if you're on an older version, this guide covers how to update. Once you're current, Mux Data gives you new tools for examining these metrics.
Analyze changes or patterns over time
Playing time by rendition shows consumption across any time frame you select. The measurement is wall-clock: it reflects the actual time a viewer spent watching a given rendition, not the media's playback timestamp. That means playback speed doesn't change what's counted; 5 minutes spent watching is counted as 5 minutes. Time spent paused, rebuffering, or seeking is excluded from the metric.
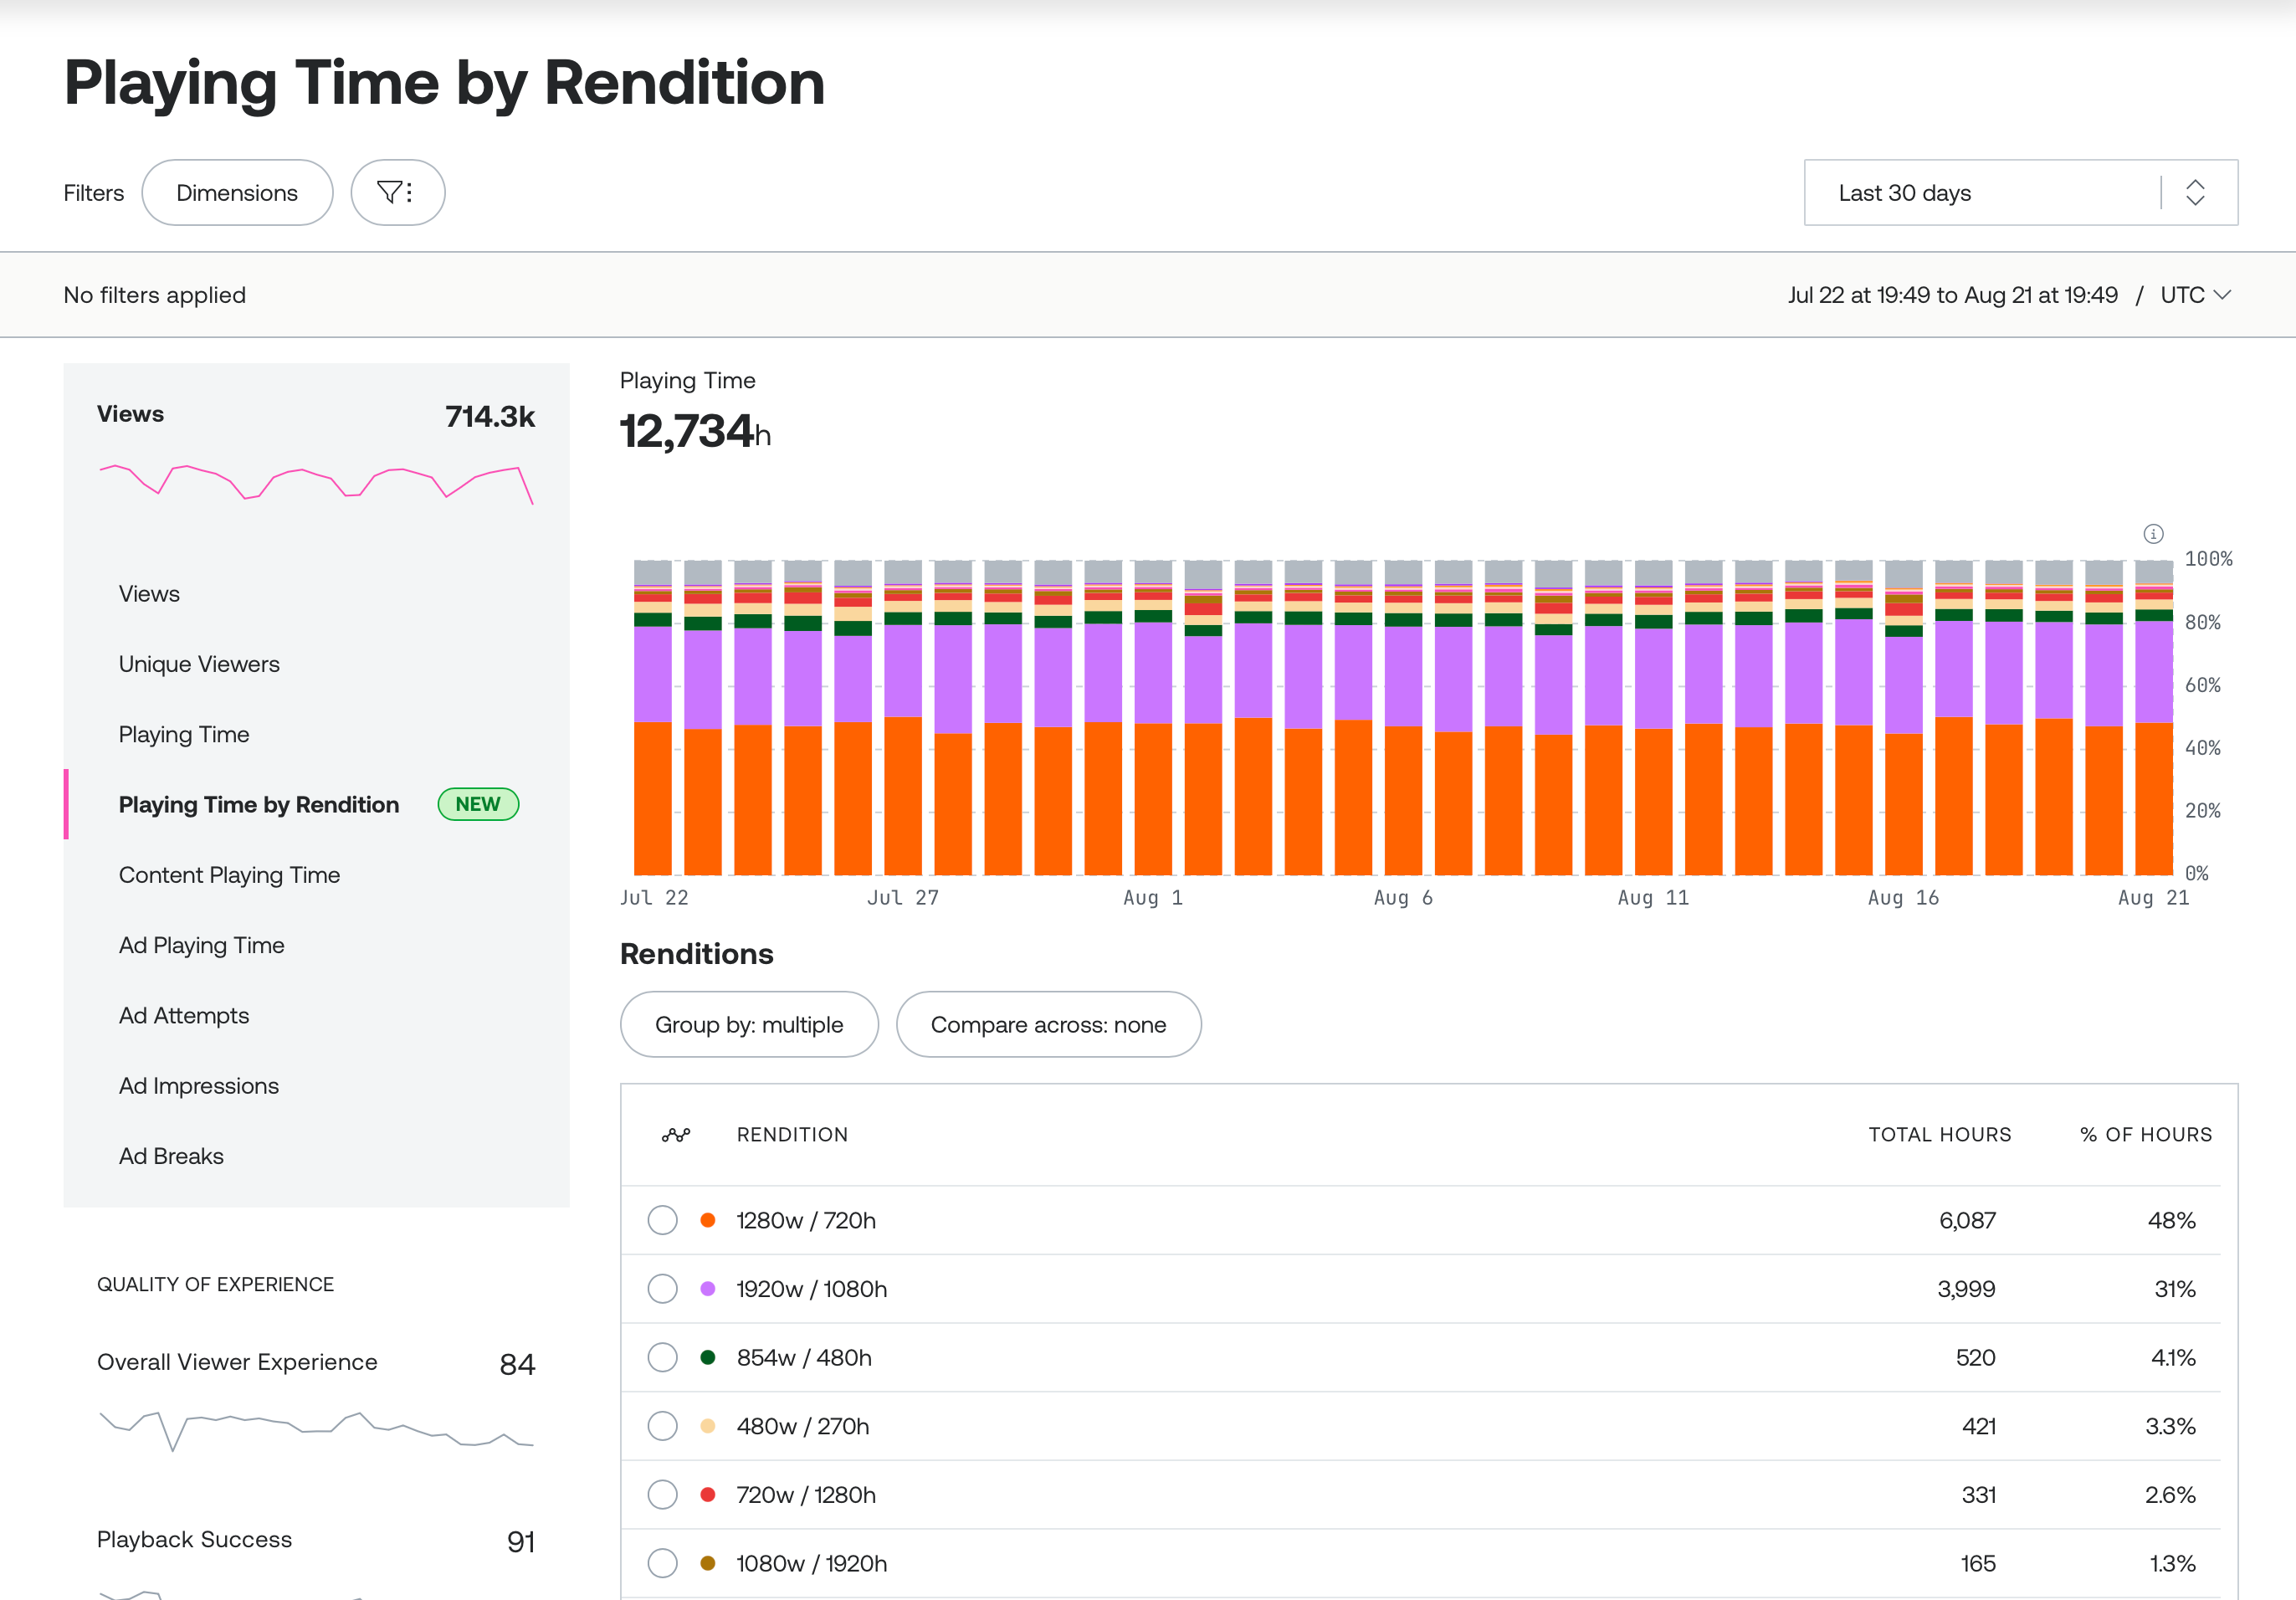
The dashboard shows this as a time-series view, with stacked bars representing proportional consumption of the top 10 renditions and an "other" category for the rest.
You can use this to see how much of your viewers' time is spent at 1080p vs. 720p vs. lower resolutions, or track uptake as you roll out new 4K content. Watching the time series shift as you adjust encoding settings makes it easier to judge whether changes are actually landing the way you intended.
A few questions you can ask as you look at your own data: Are there underutilized rungs on your bitrate ladder? If a rendition never gets delivered at all, is that an opportunity to set a lower max_resolution_tier at ingest?
Use filters to focus analysis
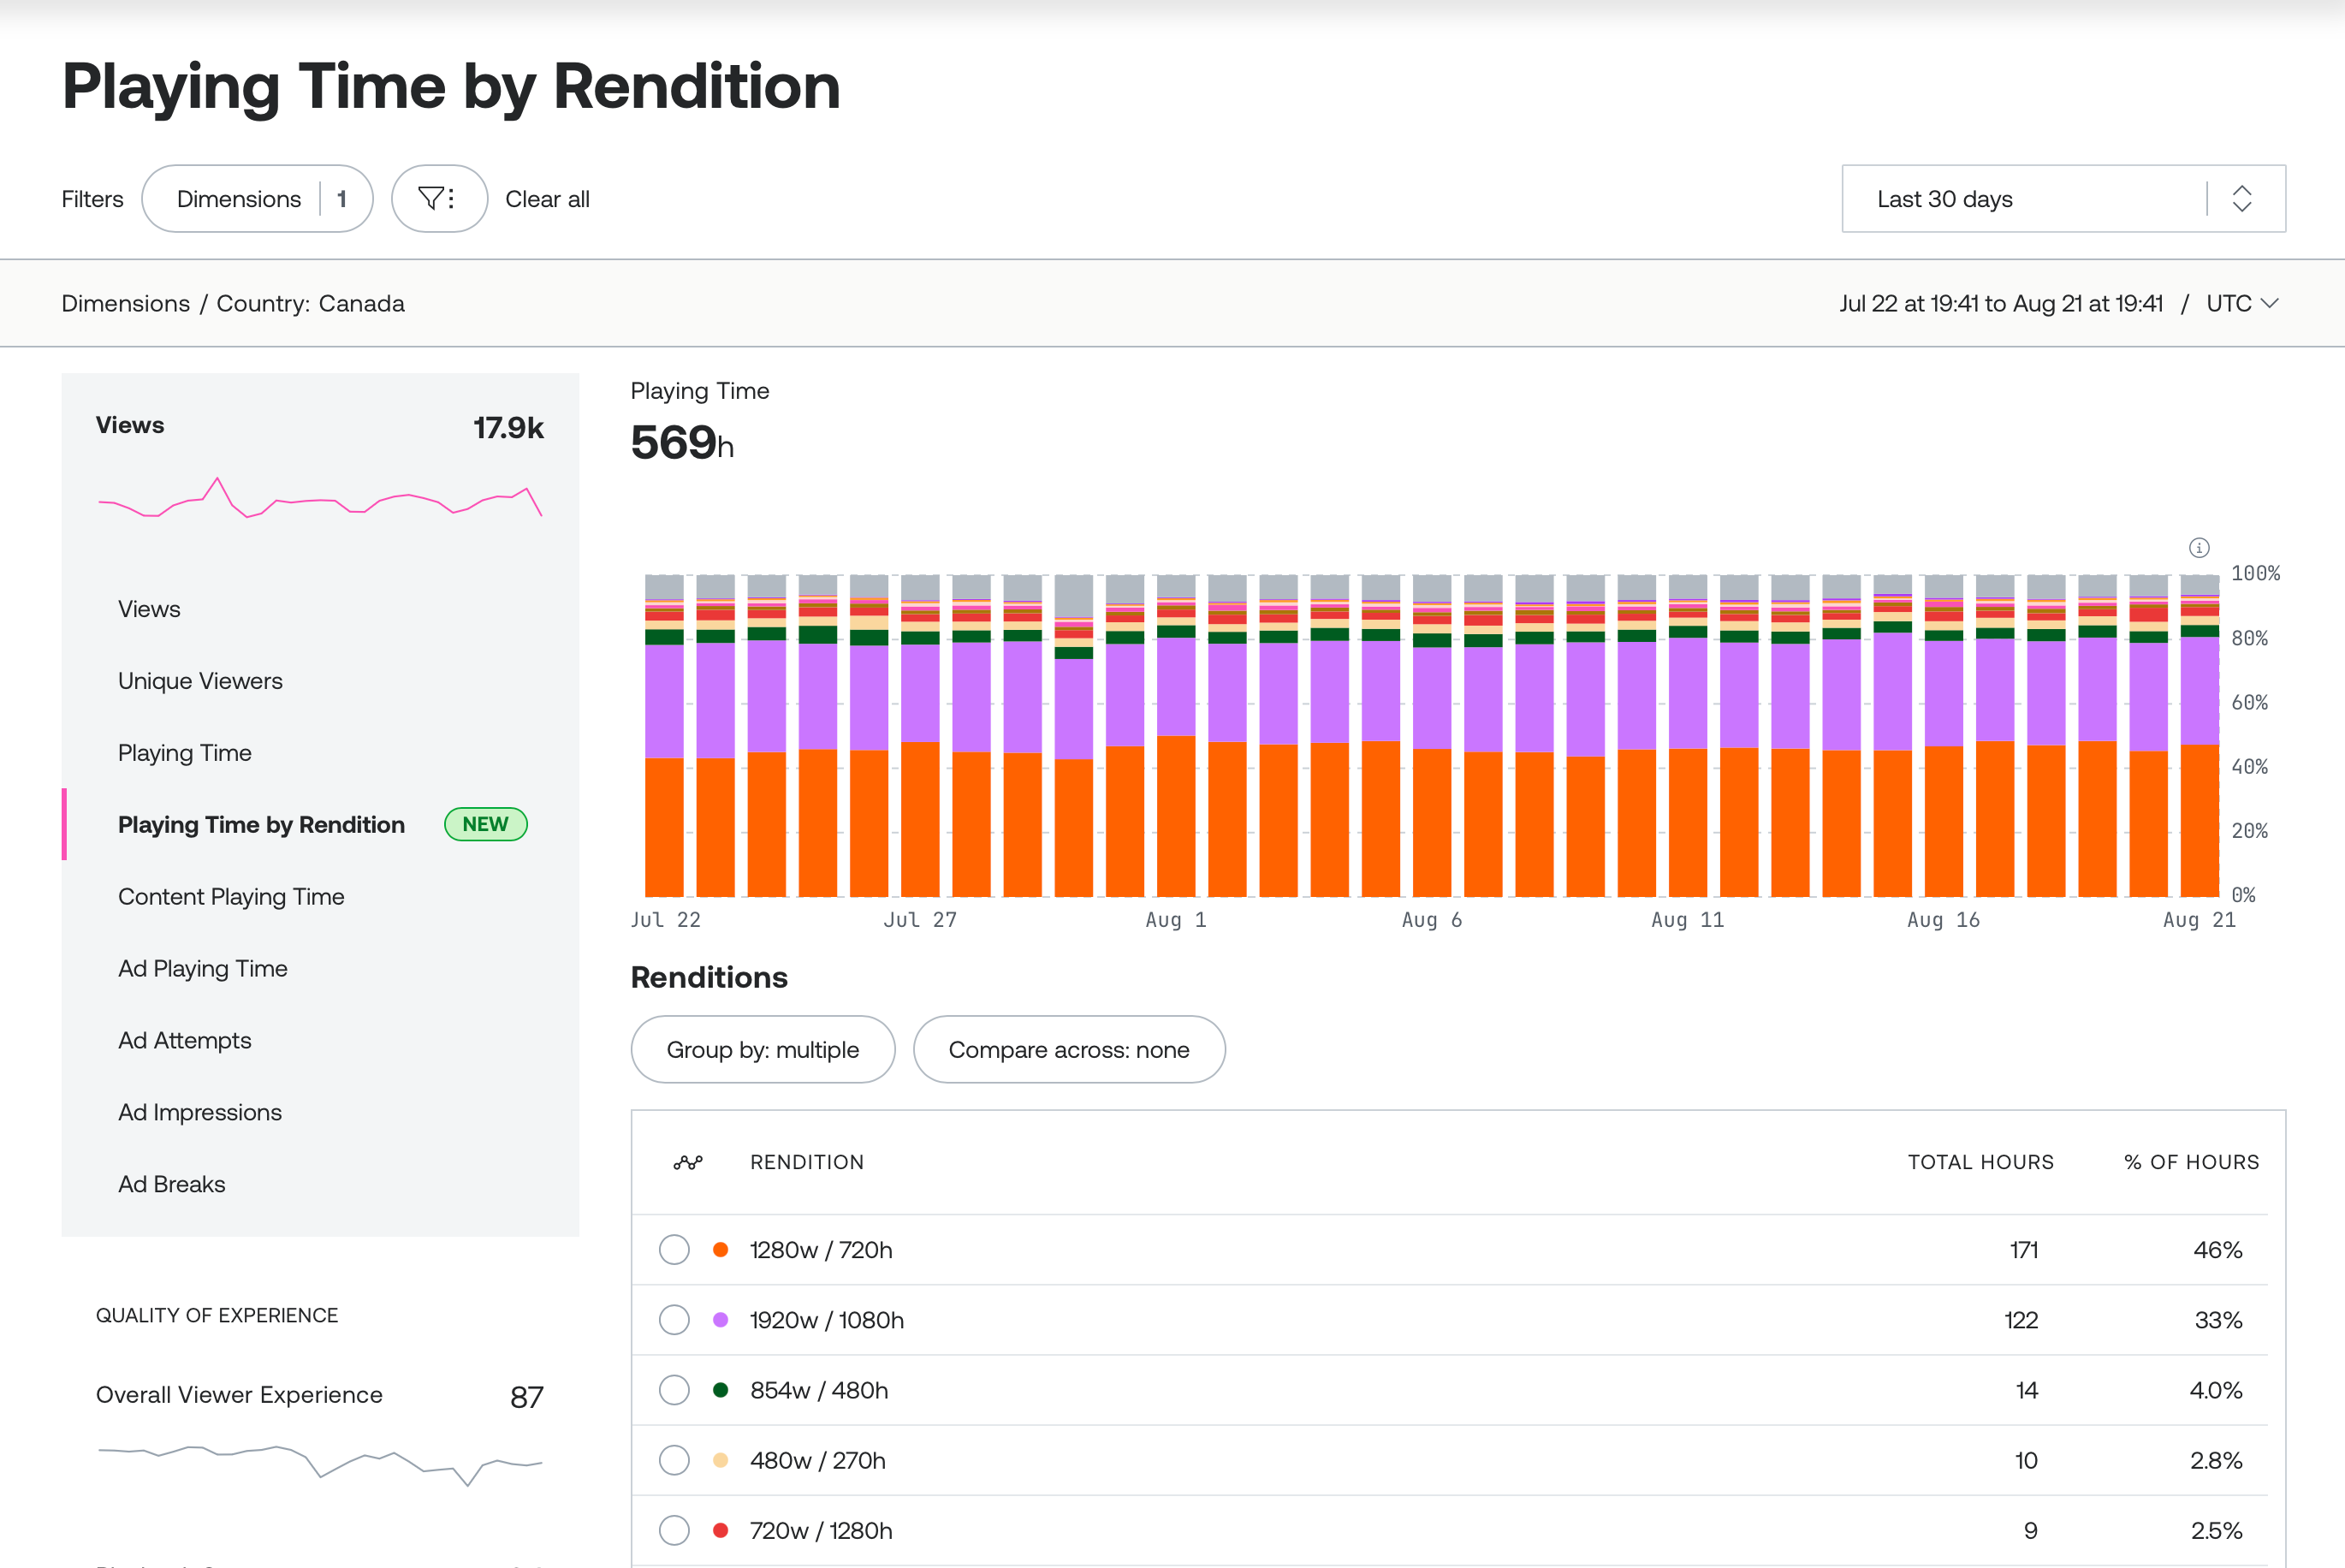
Playing time by rendition gets more useful when you apply filters. A library with per-title or variable-bitrate encoding can include a wide range of resolution, frame rate, and bitrate combinations across its renditions.
Filtering helps you focus the view. You can narrow and scope the data to a specific title, country, or device category to see the rendition mix a specific segment of your audience actually experiences, not just what's happening in the aggregate.
Compare experiences across a category
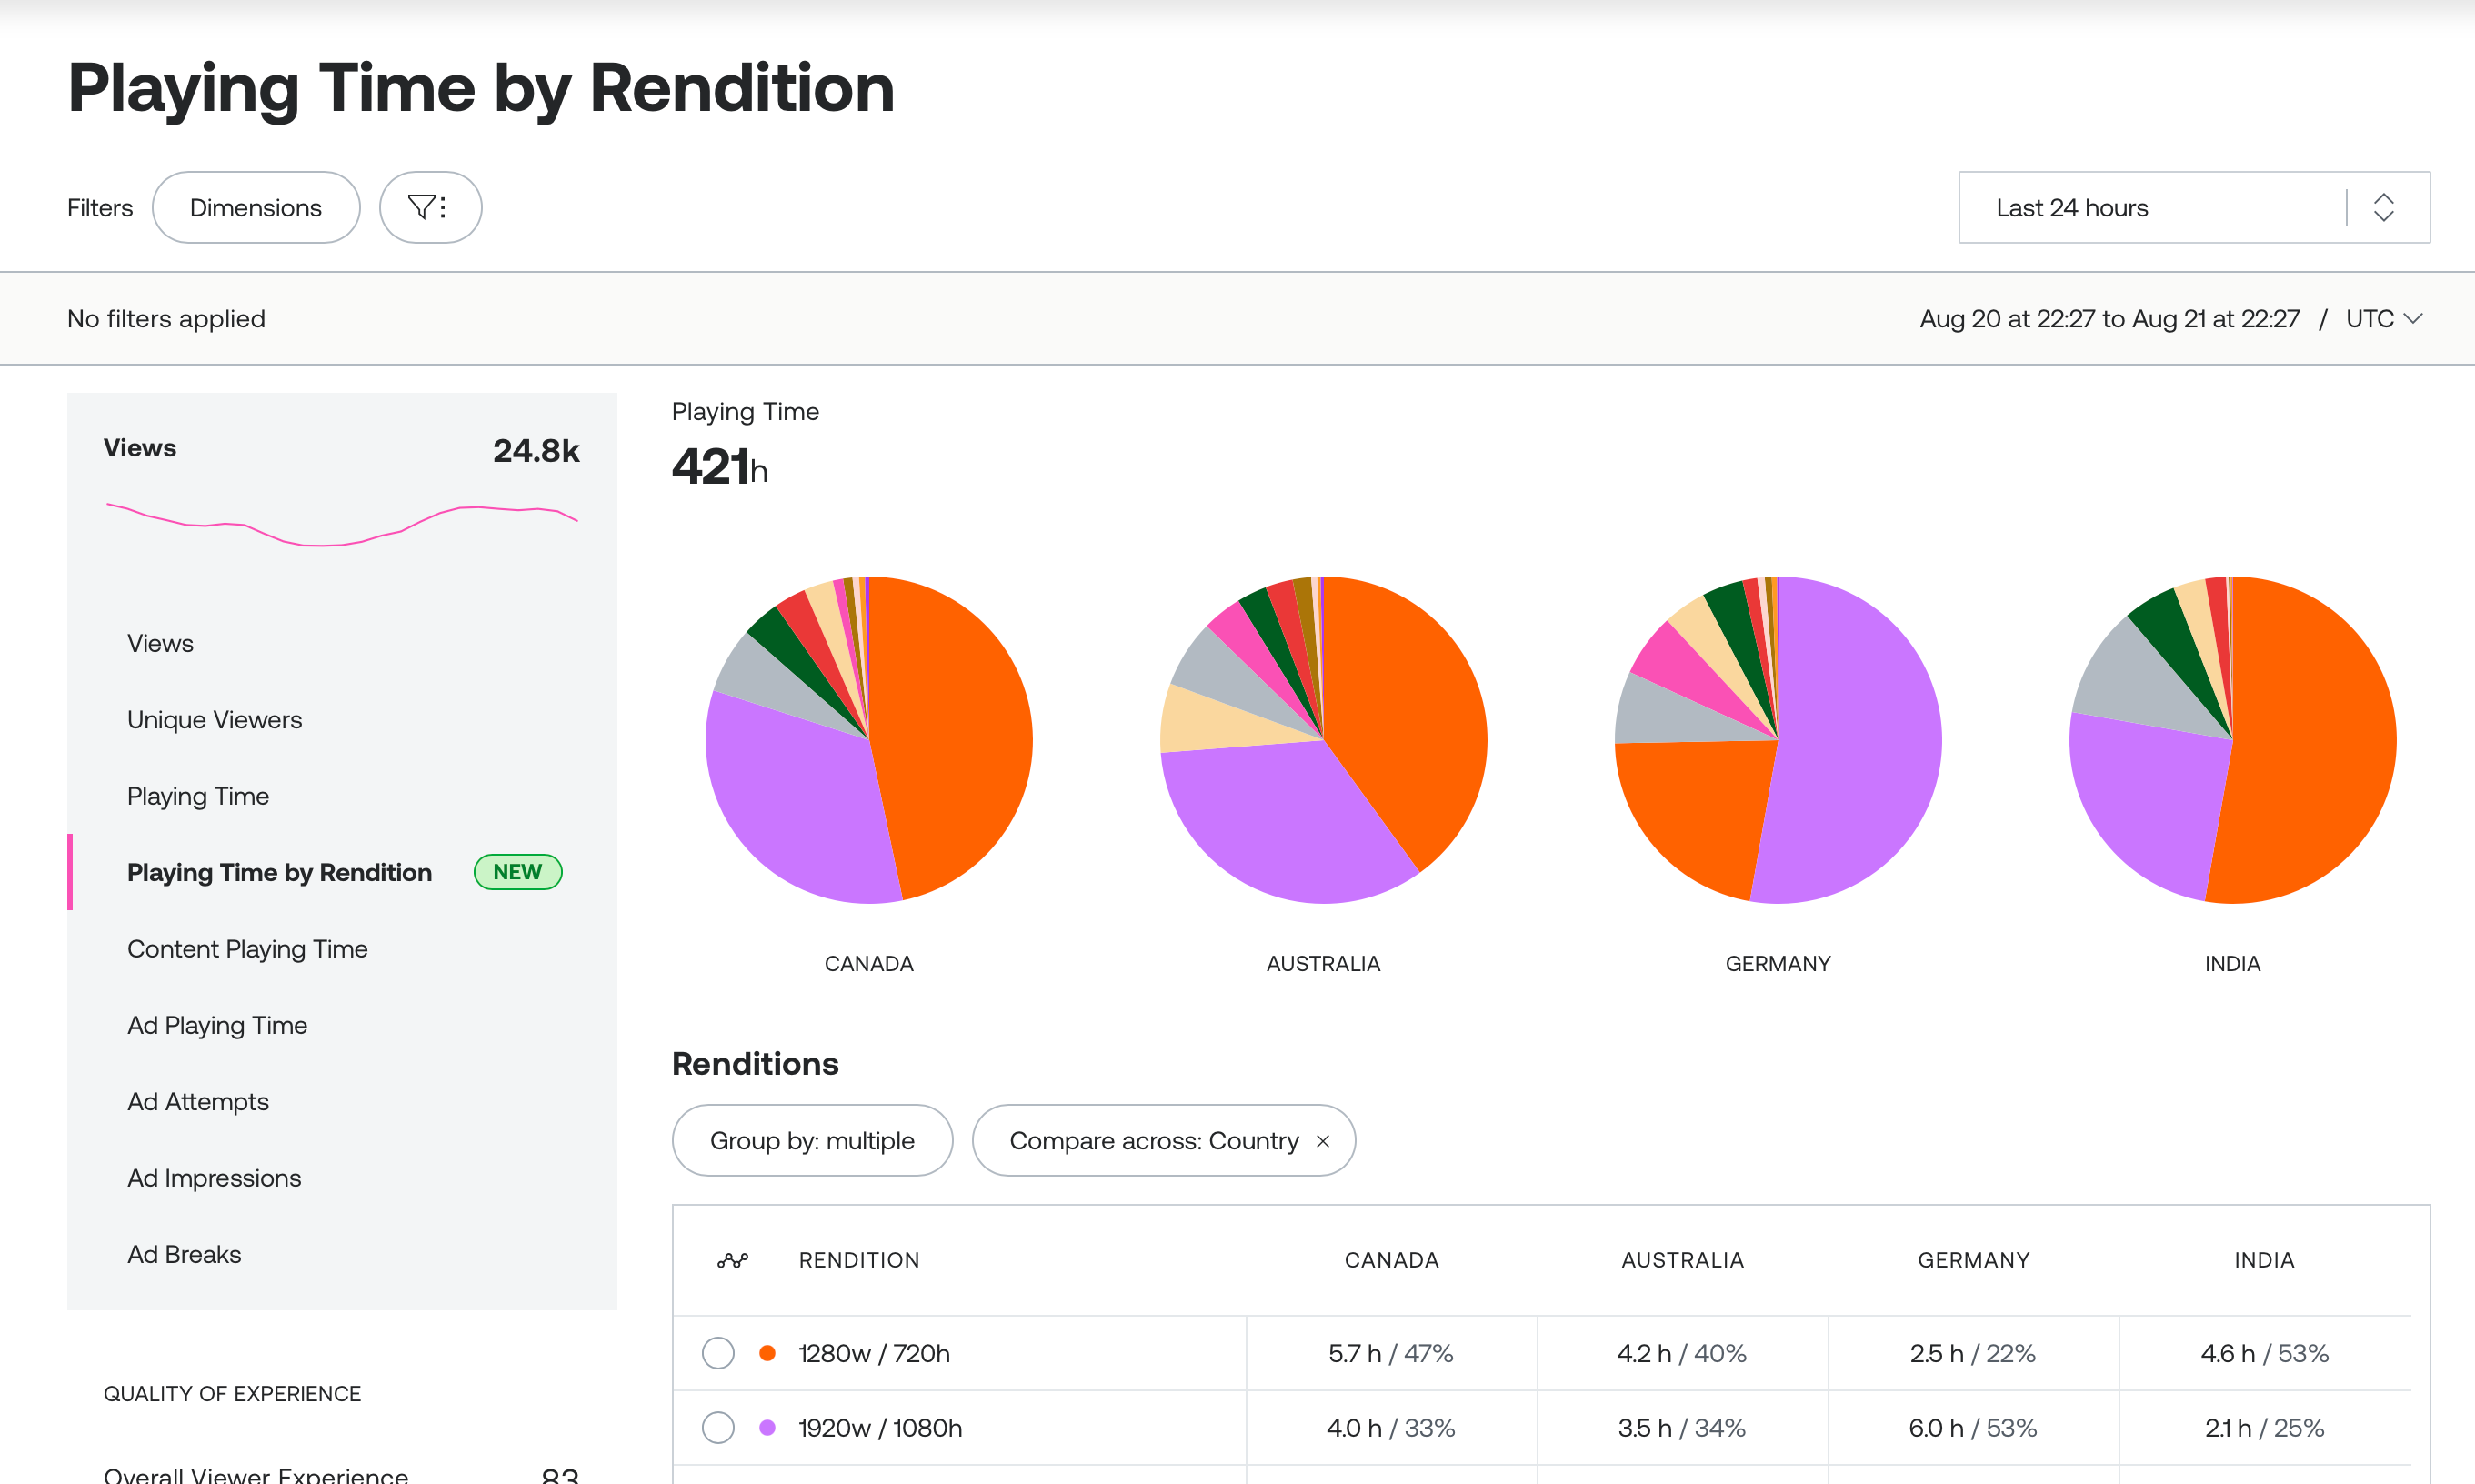
The dashboard also lets you compare rendition consumption across a dimension like country or operating system. Use “Compare across” to select different countries to compare how viewing behavior and network conditions affect which renditions get delivered for those regions.
Adjust rendition grouping
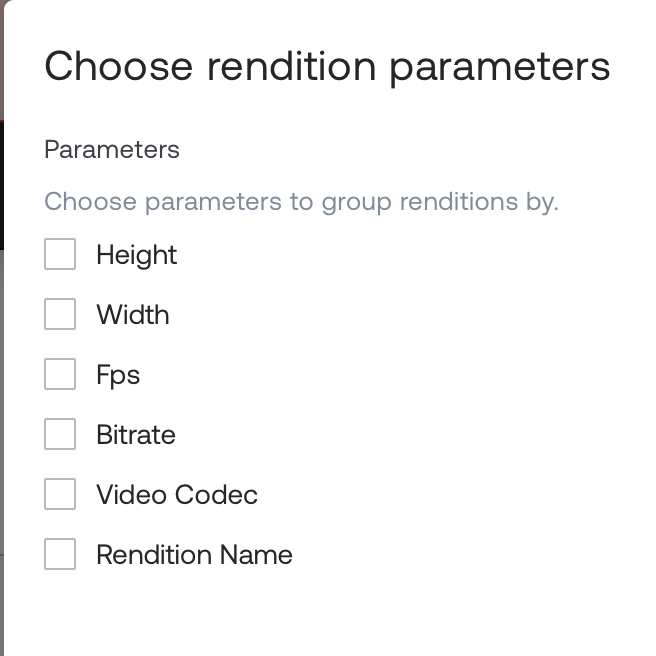
By default, the dashboard groups renditions by every parameter players report: height, width, frame rate, bitrate, video codec, and rendition name. You can narrow that down to a subset of rendition parameters instead. For example, selecting only width and height groups all 1280x720 renditions together, regardless of bitrate and frame rate. This is useful when players report a wide range of bitrates but resolution is what you actually want to analyze.
Get started
You can find Playing time by rendition in your Mux Data dashboard today. In the left nav, go to Data > Metrics and select Views > Playing time by rendition.
Learn more about how to get started in our guide.
We're working on making this data available via API. Keep your eyes open for that update.