Track playing time by rendition
See how much time viewers spend watching each video rendition (resolution, bitrate, frame rate, and codec), in the Mux dashboard and with the Subview Metrics API.
In this guide:
Collect subview metrics data via SDK
Collect subview metrics data via SDK
View total playing time by rendition
View total playing time by rendition
See a breakdown over time
See a breakdown over time
Rank renditions by playing time
Rank renditions by playing time
Customize which rendition attributes to group by
Customize which rendition attributes to group by
Compare renditions across a dimension
Compare renditions across a dimension
Overview
Every view moves through one or more renditions — the specific resolution, bitrate, frame rate, and codec combination a player is actually receiving at a given moment, as network conditions and player logic shift the stream up or down an encoding ladder. Playing time by rendition tells you how much aggregate player wall clock time viewers actually spent in each rendition, across the full lifetime of the view sessions.
Use this to answer questions like:
- How much of my viewers' time is spent at 1080p vs. 720p vs. lower resolutions?
- Is a new 4K offering actually being watched, or rarely reached?
- Are there rungs on my bitrate ladder that are underutilized?
- For a specific title, country, or device, what rendition mix are viewers actually experiencing?
- Are there regional or device differences that jump out in a breakdown comparison?
This guide covers both the Mux dashboard and the underlying Data API, so you can use whichever fits your workflow — or both.
Collect subview metrics data via SDK
Playing time by rendition data will not be collected if your SDK does not meet the minimum requirements.
| Platform | Package | Minimum version |
|---|---|---|
| Web | @mux/mux-player | v3.11.4 (bundles mux-embed ≥5.16.1) |
| Android | mux-player-android | v1.5.3 (bundles mux-stats-sdk-java ≥8.8.0) |
| iOS | mux-player-swift | v1.2.1 or later, and a resolved mux-stats-sdk-avplayer ≥4.10.0 |
If you're on a custom integration instead of Mux Player, confirm your core SDK version directly: mux-embed ≥5.13.0, stats-sdk-java ≥8.6.0, or stats-sdk-objc ≥5.7.0.
On iOS, updating mux-player-swift opens the door to a qualifying stats-sdk-objc version, but an existing Package.resolved lock can keep you pinned to an older one. Re-resolve your dependencies (swift package update) and confirm mux-stats-sdk-avplayer resolves to 4.10.0 or later.
View total playing time by rendition
In the dashboard
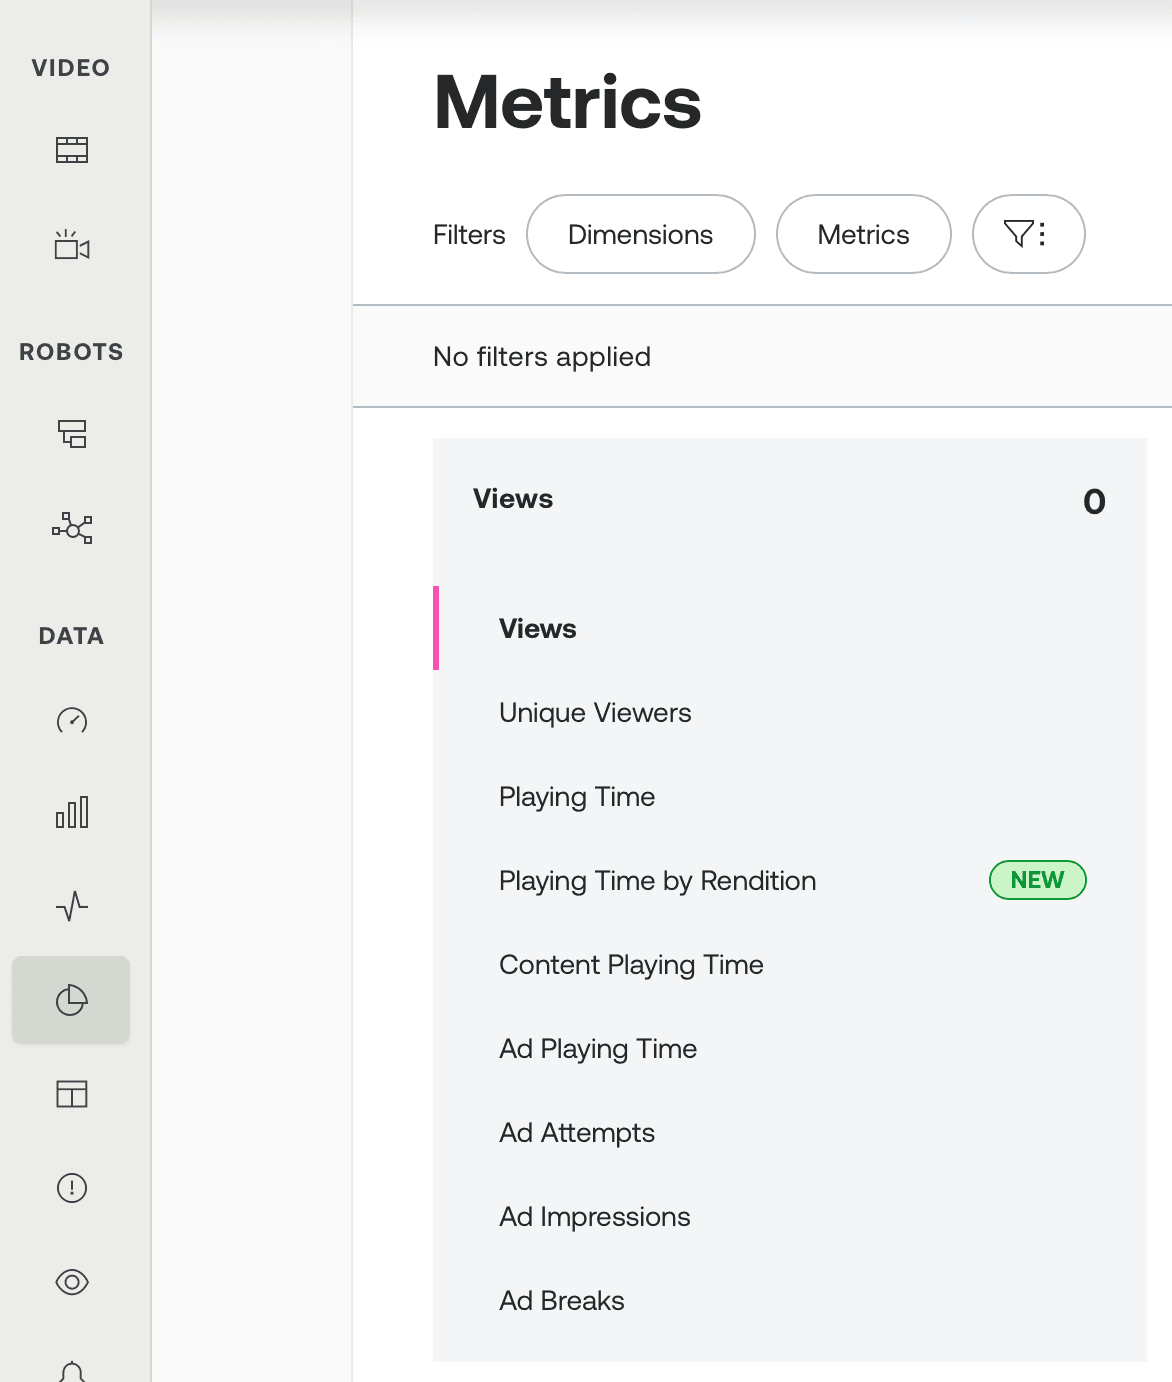
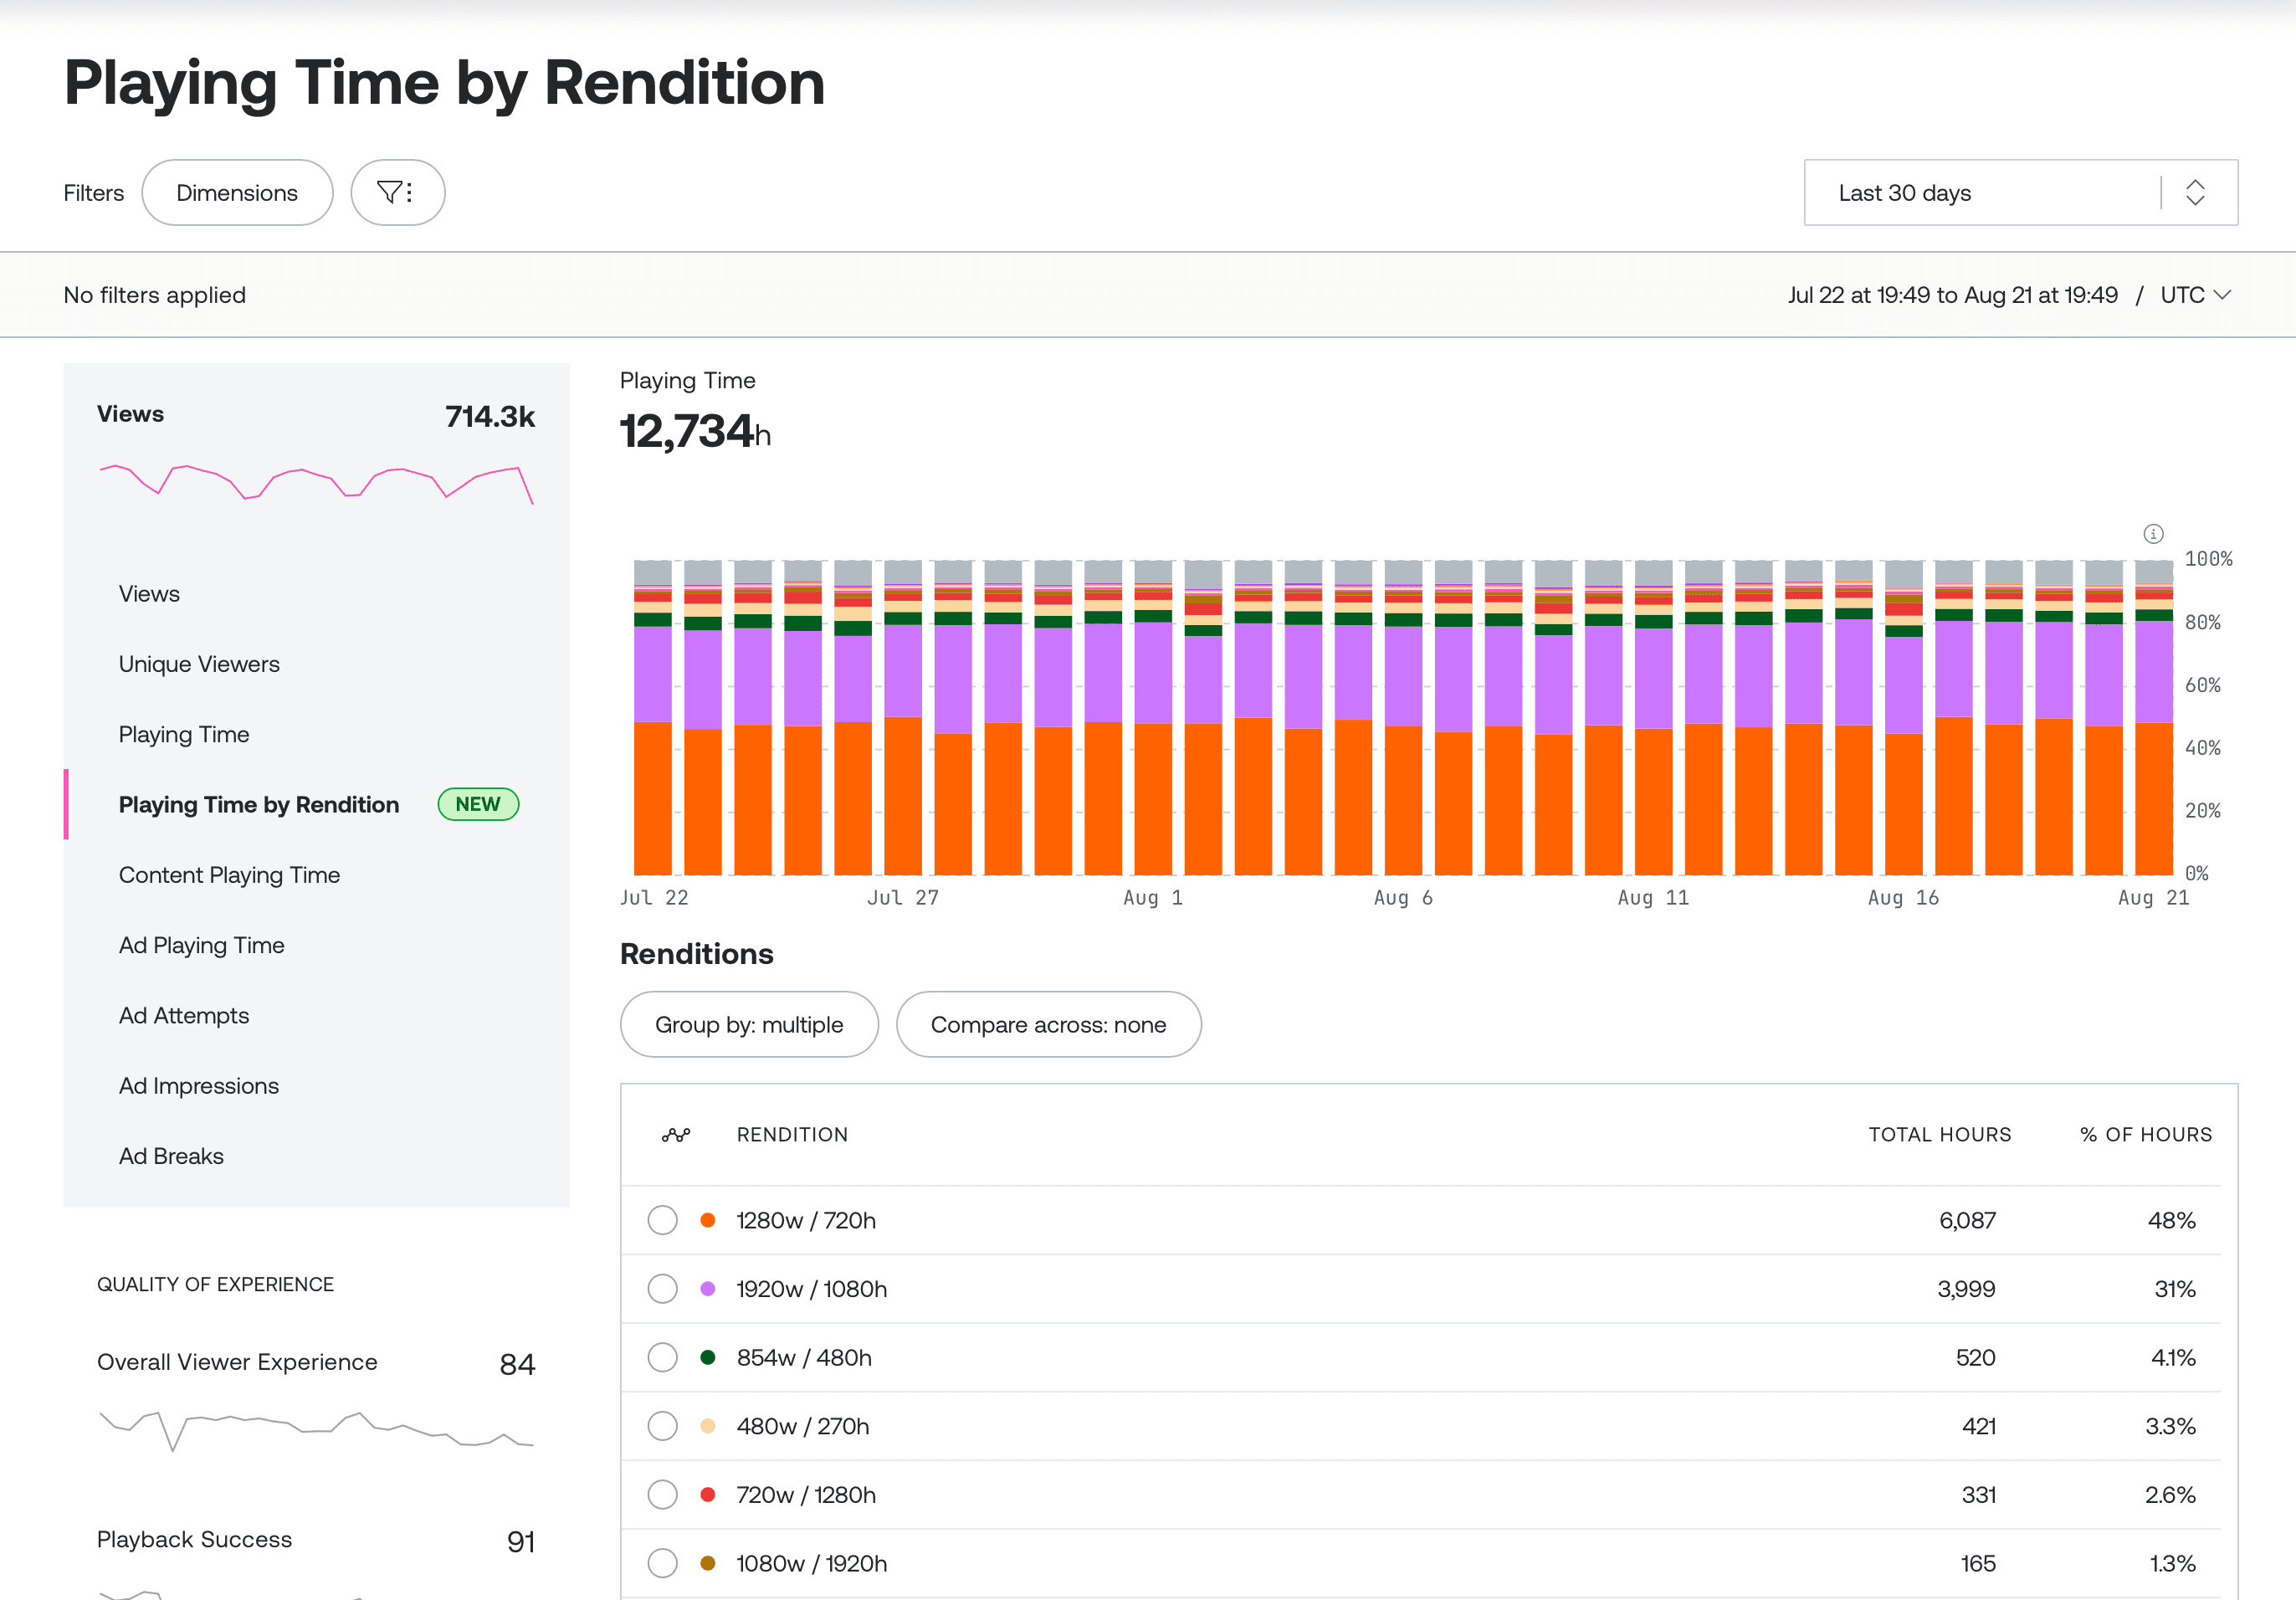
Go to the Metrics page in your environment and open Playing time by rendition under the Views section in the metrics explorer. The page opens with total playing time for the current filters and time range shown above the chart, with the default timeseries breakdown and ranked rendition table below it.
Using the API
curl 'https://api.mux.com/data/v1/subview-metrics/playing_time/rendition/overall?timeframe[]=30:days' \
  -u ${MUX_TOKEN_ID}:${MUX_TOKEN_SECRET}
{
"data": { "metric_value": 186400000 },
"meta": { "metric": "playing_time", "subview_type": "rendition", "unit": "ms" },
"total_row_count": null,
"timeframe": [1617235200, 1617321600]
}data.metric_value is in milliseconds. total_row_count is always null for this endpoint — a single aggregate value has no row count.
See a breakdown over time
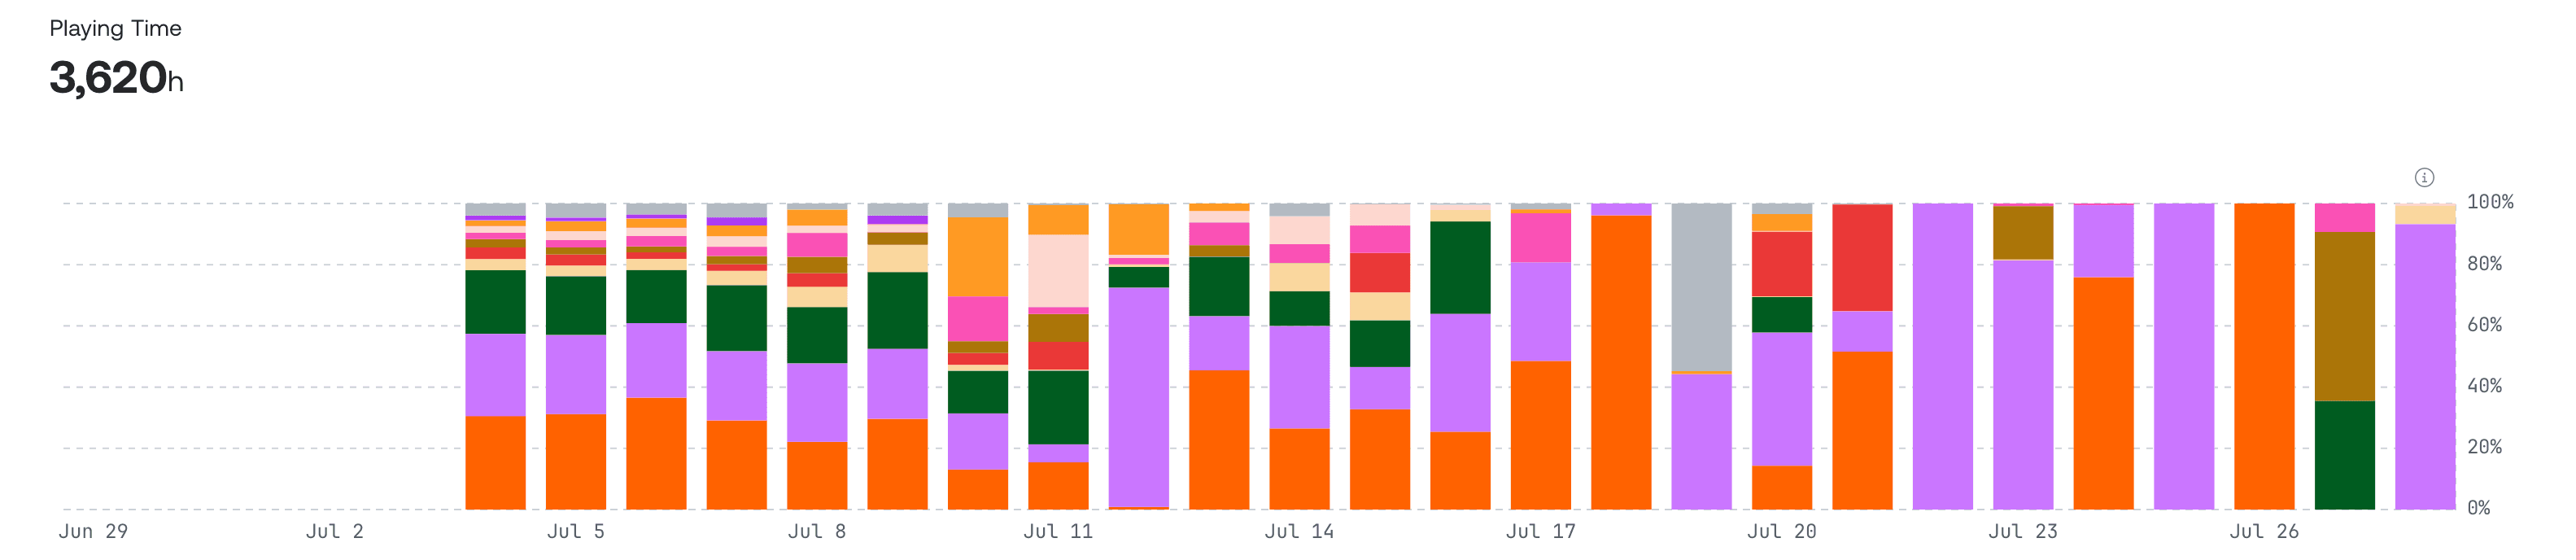
By default, the page charts playing time per rendition across the selected time range, so you can see how your audience's rendition mix shifts over time — for example, after a new encoding profile ships.
In the dashboard
The timeseries chart is the default visualization. Each color represents a distinct rendition (grouped according to your current group by selection); select rows in the table below the chart to highlight specific renditions.
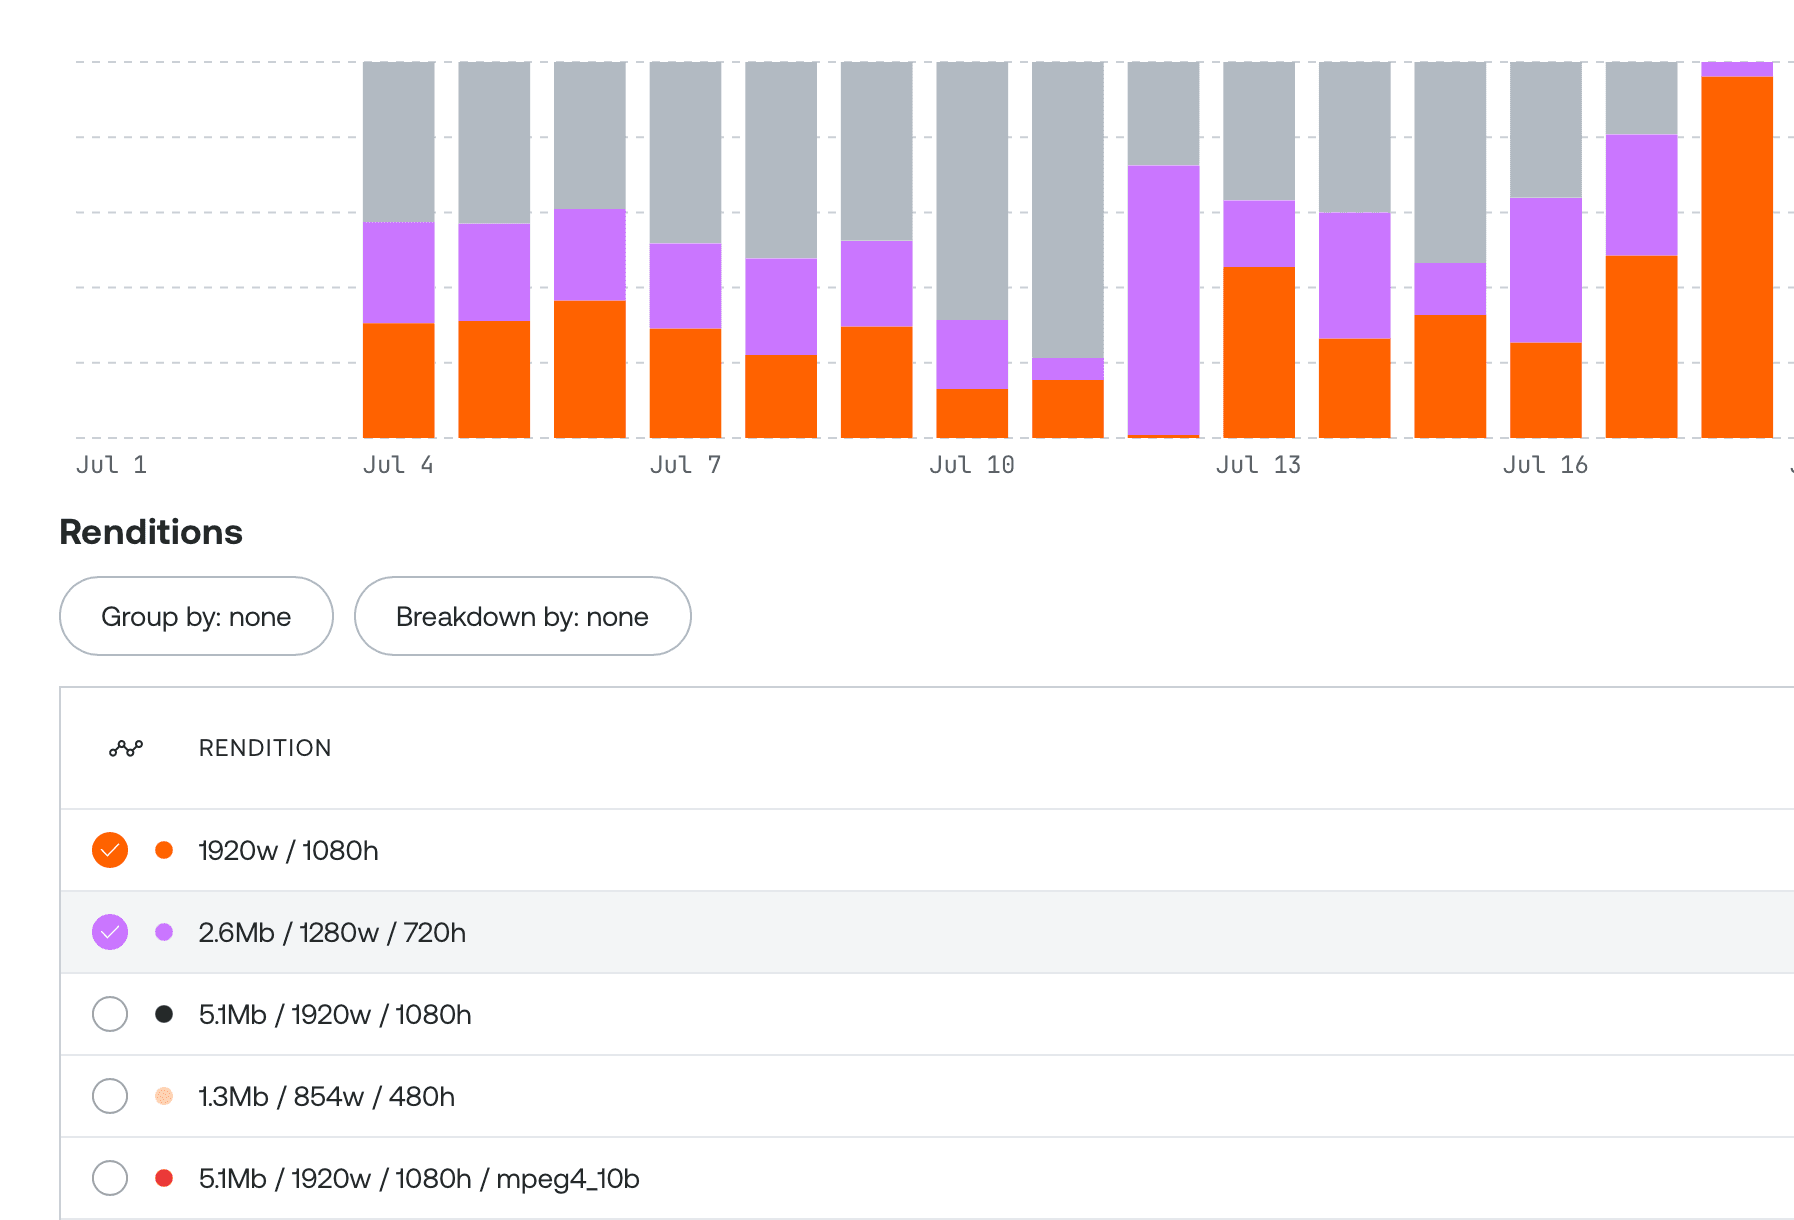
Select a rendition's checkbox in the table to highlight just that rendition in the chart above; deselect others to isolate a single one or a subset for comparison.
Using the API
curl 'https://api.mux.com/data/v1/subview-metrics/playing_time/rendition/breakdown-timeseries?timeframe[]=30:days&time_granularity=hour' \
  -u ${MUX_TOKEN_ID}:${MUX_TOKEN_SECRET}
{
"data": [
{
"values": [
{
"breakdown_value": "18.5Mb / 3840w / 2160h / 60fps / HEVC",
"metric_value": 12500000,
"group_by_values": [18.5, 3840, 2160, 60, "HEVC", ""]
},
{
"breakdown_value": "12.0Mb / 1920w / 1080h / 30fps / HEVC",
"metric_value": 6300000,
"group_by_values": [12.0, 1920, 1080, 30, "HEVC", ""]
},
{ "breakdown_value": "other", "metric_value": 900000 }
],
"status": "complete",
"date": "2021-04-01T00:00:00Z"
}
],
"meta": {
"subview_type": "rendition",
"metric": "playing_time",
"unit": "ms",
"time_granularity": "hour",
"group_by": [
"video_source_bitrate",
"video_source_width",
"video_source_height",
"video_source_fps",
"video_source_codec",
"video_source_rendition_name"
],
"complete_through": "2021-04-01T17:00:00Z"
},
"total_row_count": 720,
"timeframe": [1617235200, 1617321600]
}time_granularity accepts hour or day. Time buckets that have been processed with no data are still included with metric_value: 0, so you can render a complete time axis without gaps. When more renditions exist than can be reasonably charted, the response caps at the top 10 by total playing time across the timeframe and folds the remainder into an other bucket; use breakdown_value_limit (default 10, max 100) to change that cap.
Processing lag
Subview metrics have a processing lag of up to three hours, so the most recent hours in your timeframe may not have data yet. meta.complete_through marks the latest timestamp with fully processed data — the bucket it falls in is returned with status: "partial"; buckets entirely beyond it aren't returned at all.
Rank renditions by playing time
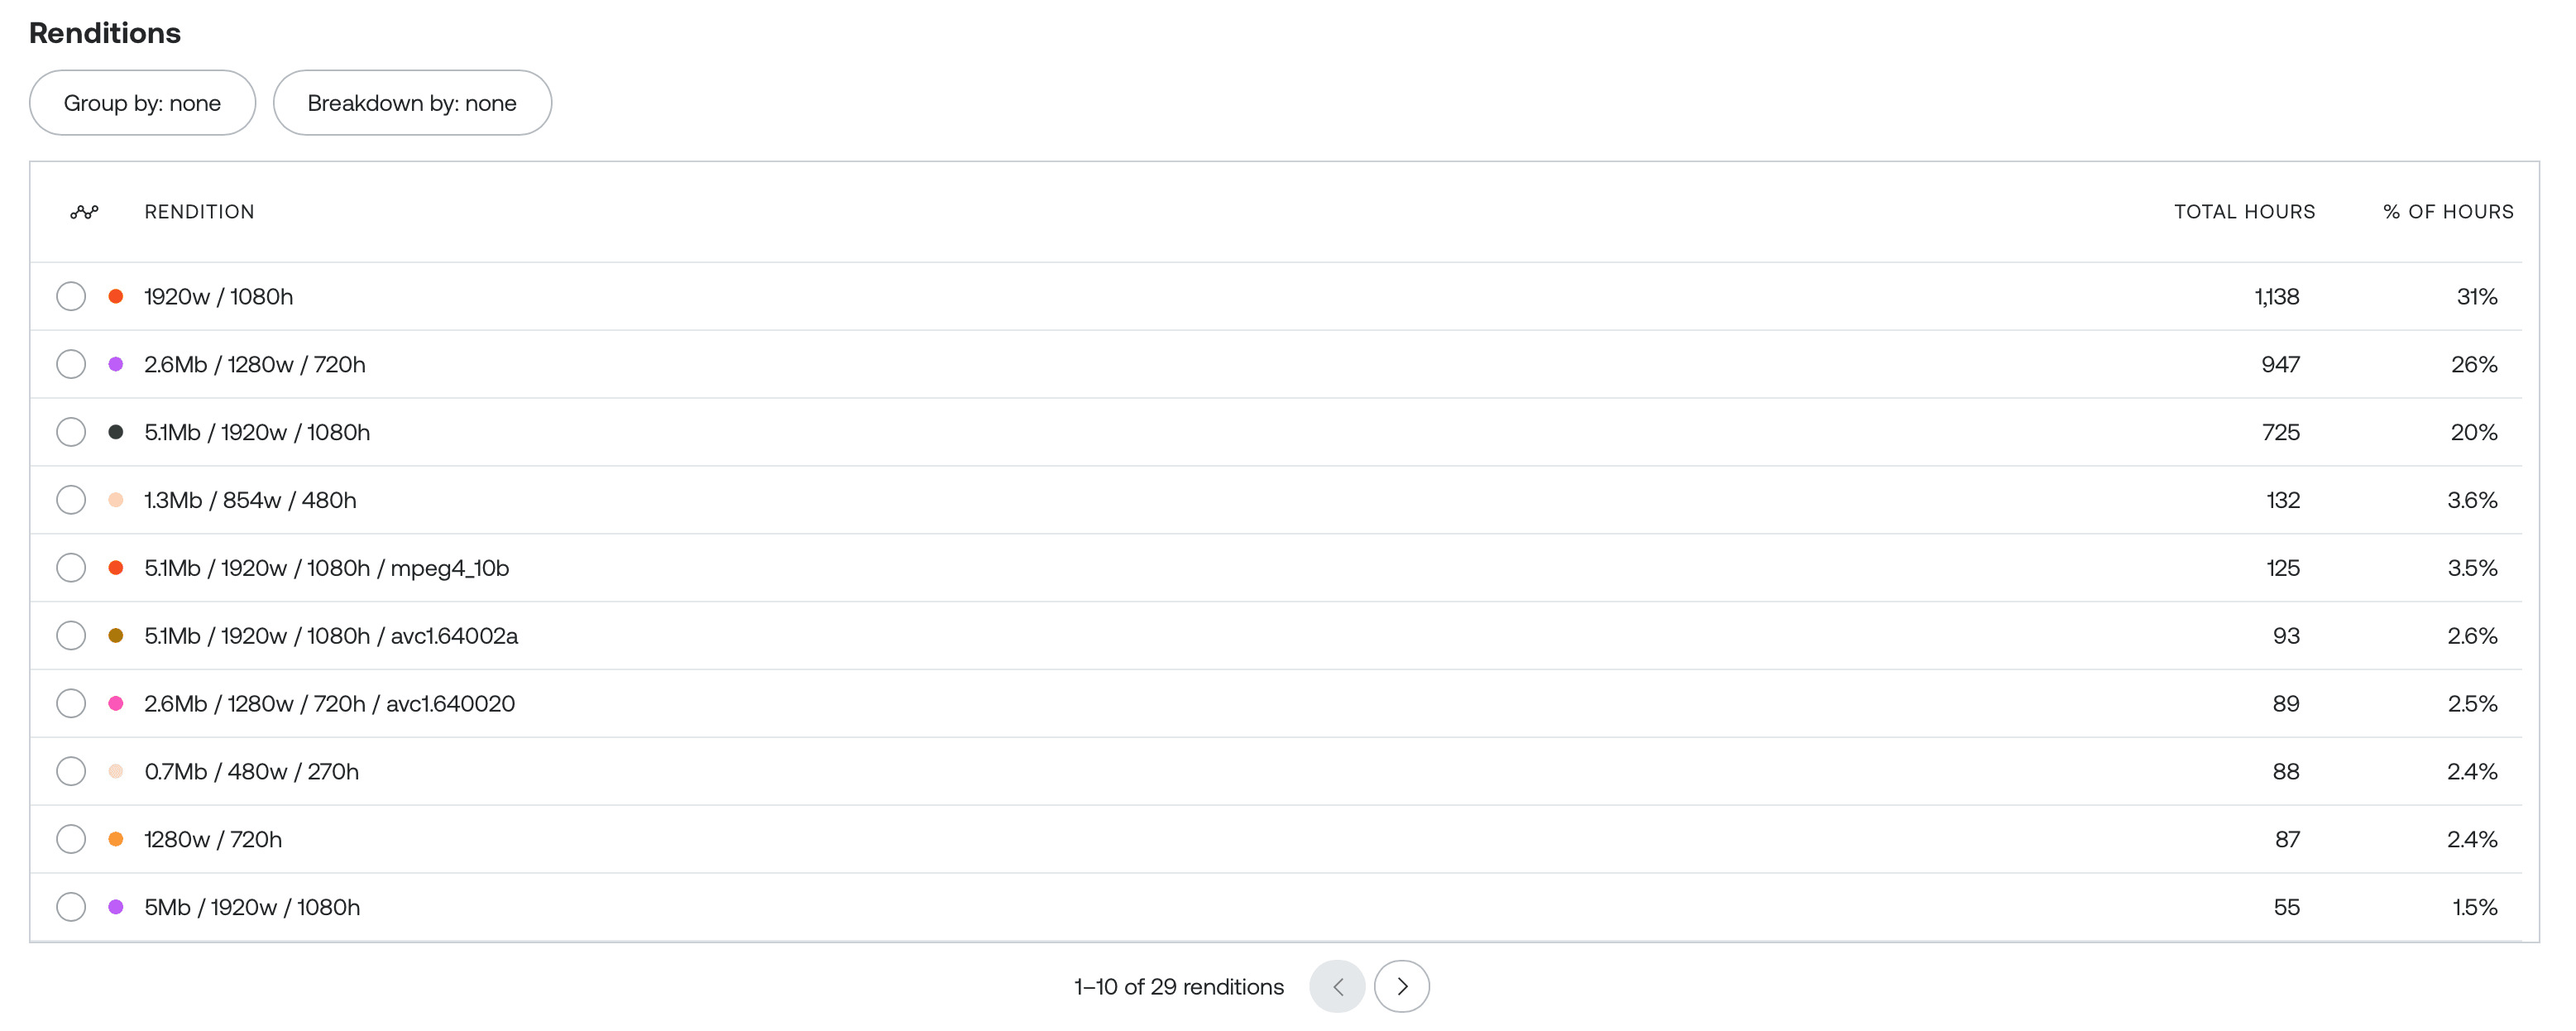
Below the chart, a table lists every rendition (or rendition combination) ranked by playing time, with its share of the total.
In the dashboard
The table below the chart lists each rendition with its playing time and percentage of total, sorted highest to lowest. Use the pagination controls below the table to paginate through additional rows if your ladder has more renditions than fit on one page.
Using the API
curl 'https://api.mux.com/data/v1/subview-metrics/playing_time/rendition/breakdown?timeframe[]=30:days&limit=25&page=1' \
  -u ${MUX_TOKEN_ID}:${MUX_TOKEN_SECRET}
{
"data": [
{
"breakdown_value": "18.5Mb / 3840w / 2160h / 60fps / HEVC",
"metric_value": 56200000,
"group_by_values": [18.5, 3840, 2160, 60, "HEVC", ""]
}
],
"meta": {
"subview_type": "rendition",
"metric": "playing_time",
"unit": "ms",
"group_by": [
"video_source_bitrate",
"video_source_width",
"video_source_height",
"video_source_fps",
"video_source_codec",
"video_source_rendition_name"
]
},
"timeframe": [1617235200, 1617321600],
"total_row_count": 1
}Customize which rendition attributes to group by
Renditions are made up of several attributes. By default, rows are grouped by the full combination of all of them, but you can narrow which attributes define a distinct row.
In the dashboard
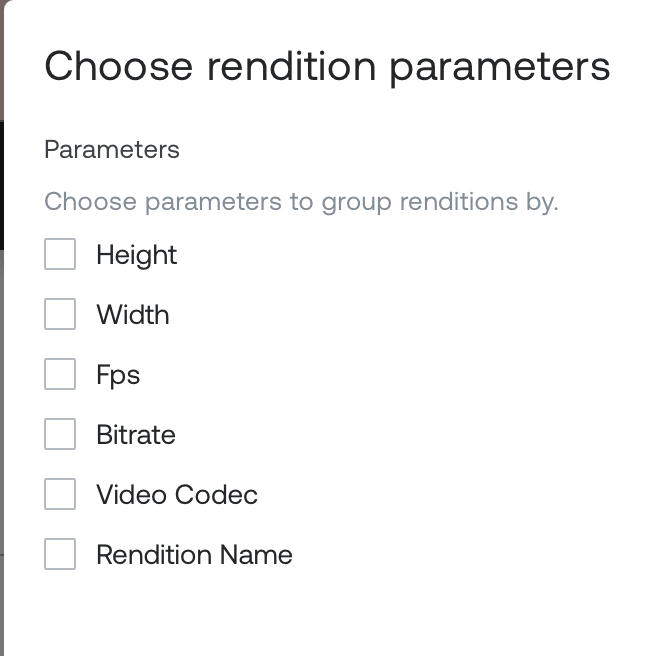
Select Group by above the table to open the Choose rendition parameters dialog, and choose which attributes to group by: Height, Width, Fps, Bitrate, Video Codec, or Rendition Name. The chart and table update together when you save.
Using the API
Pass group_by[] on any of the metric endpoints (breakdown, comparison, breakdown-timeseries):
curl 'https://api.mux.com/data/v1/subview-metrics/playing_time/rendition/breakdown?timeframe[]=30:days&group_by[]=video_source_height&group_by[]=video_source_width&group_by[]=video_source_bitrate' \
  -u ${MUX_TOKEN_ID}:${MUX_TOKEN_SECRET}
Check meta.group_by on any response for the exact field names accepted (for example video_source_height, video_source_width, video_source_bitrate). The API is opinionated about the order attributes combine in — it accepts specific combinations, not arbitrary permutations.
Compare renditions across a dimension
To see how rendition mix differs across up to four values of a dimension — for example, four specific titles, or four countries — use the Compare across: view. This replaces the timeseries chart with one pie chart per selected value, and pivots the table to show each value as its own column.
In the dashboard
Select Compare across: below the chart, choose a dimension (for example, Video Title or Country), and select up to four values to compare. The page shows one pie chart per selected value, each broken down by rendition, and the table below adds a column per value.
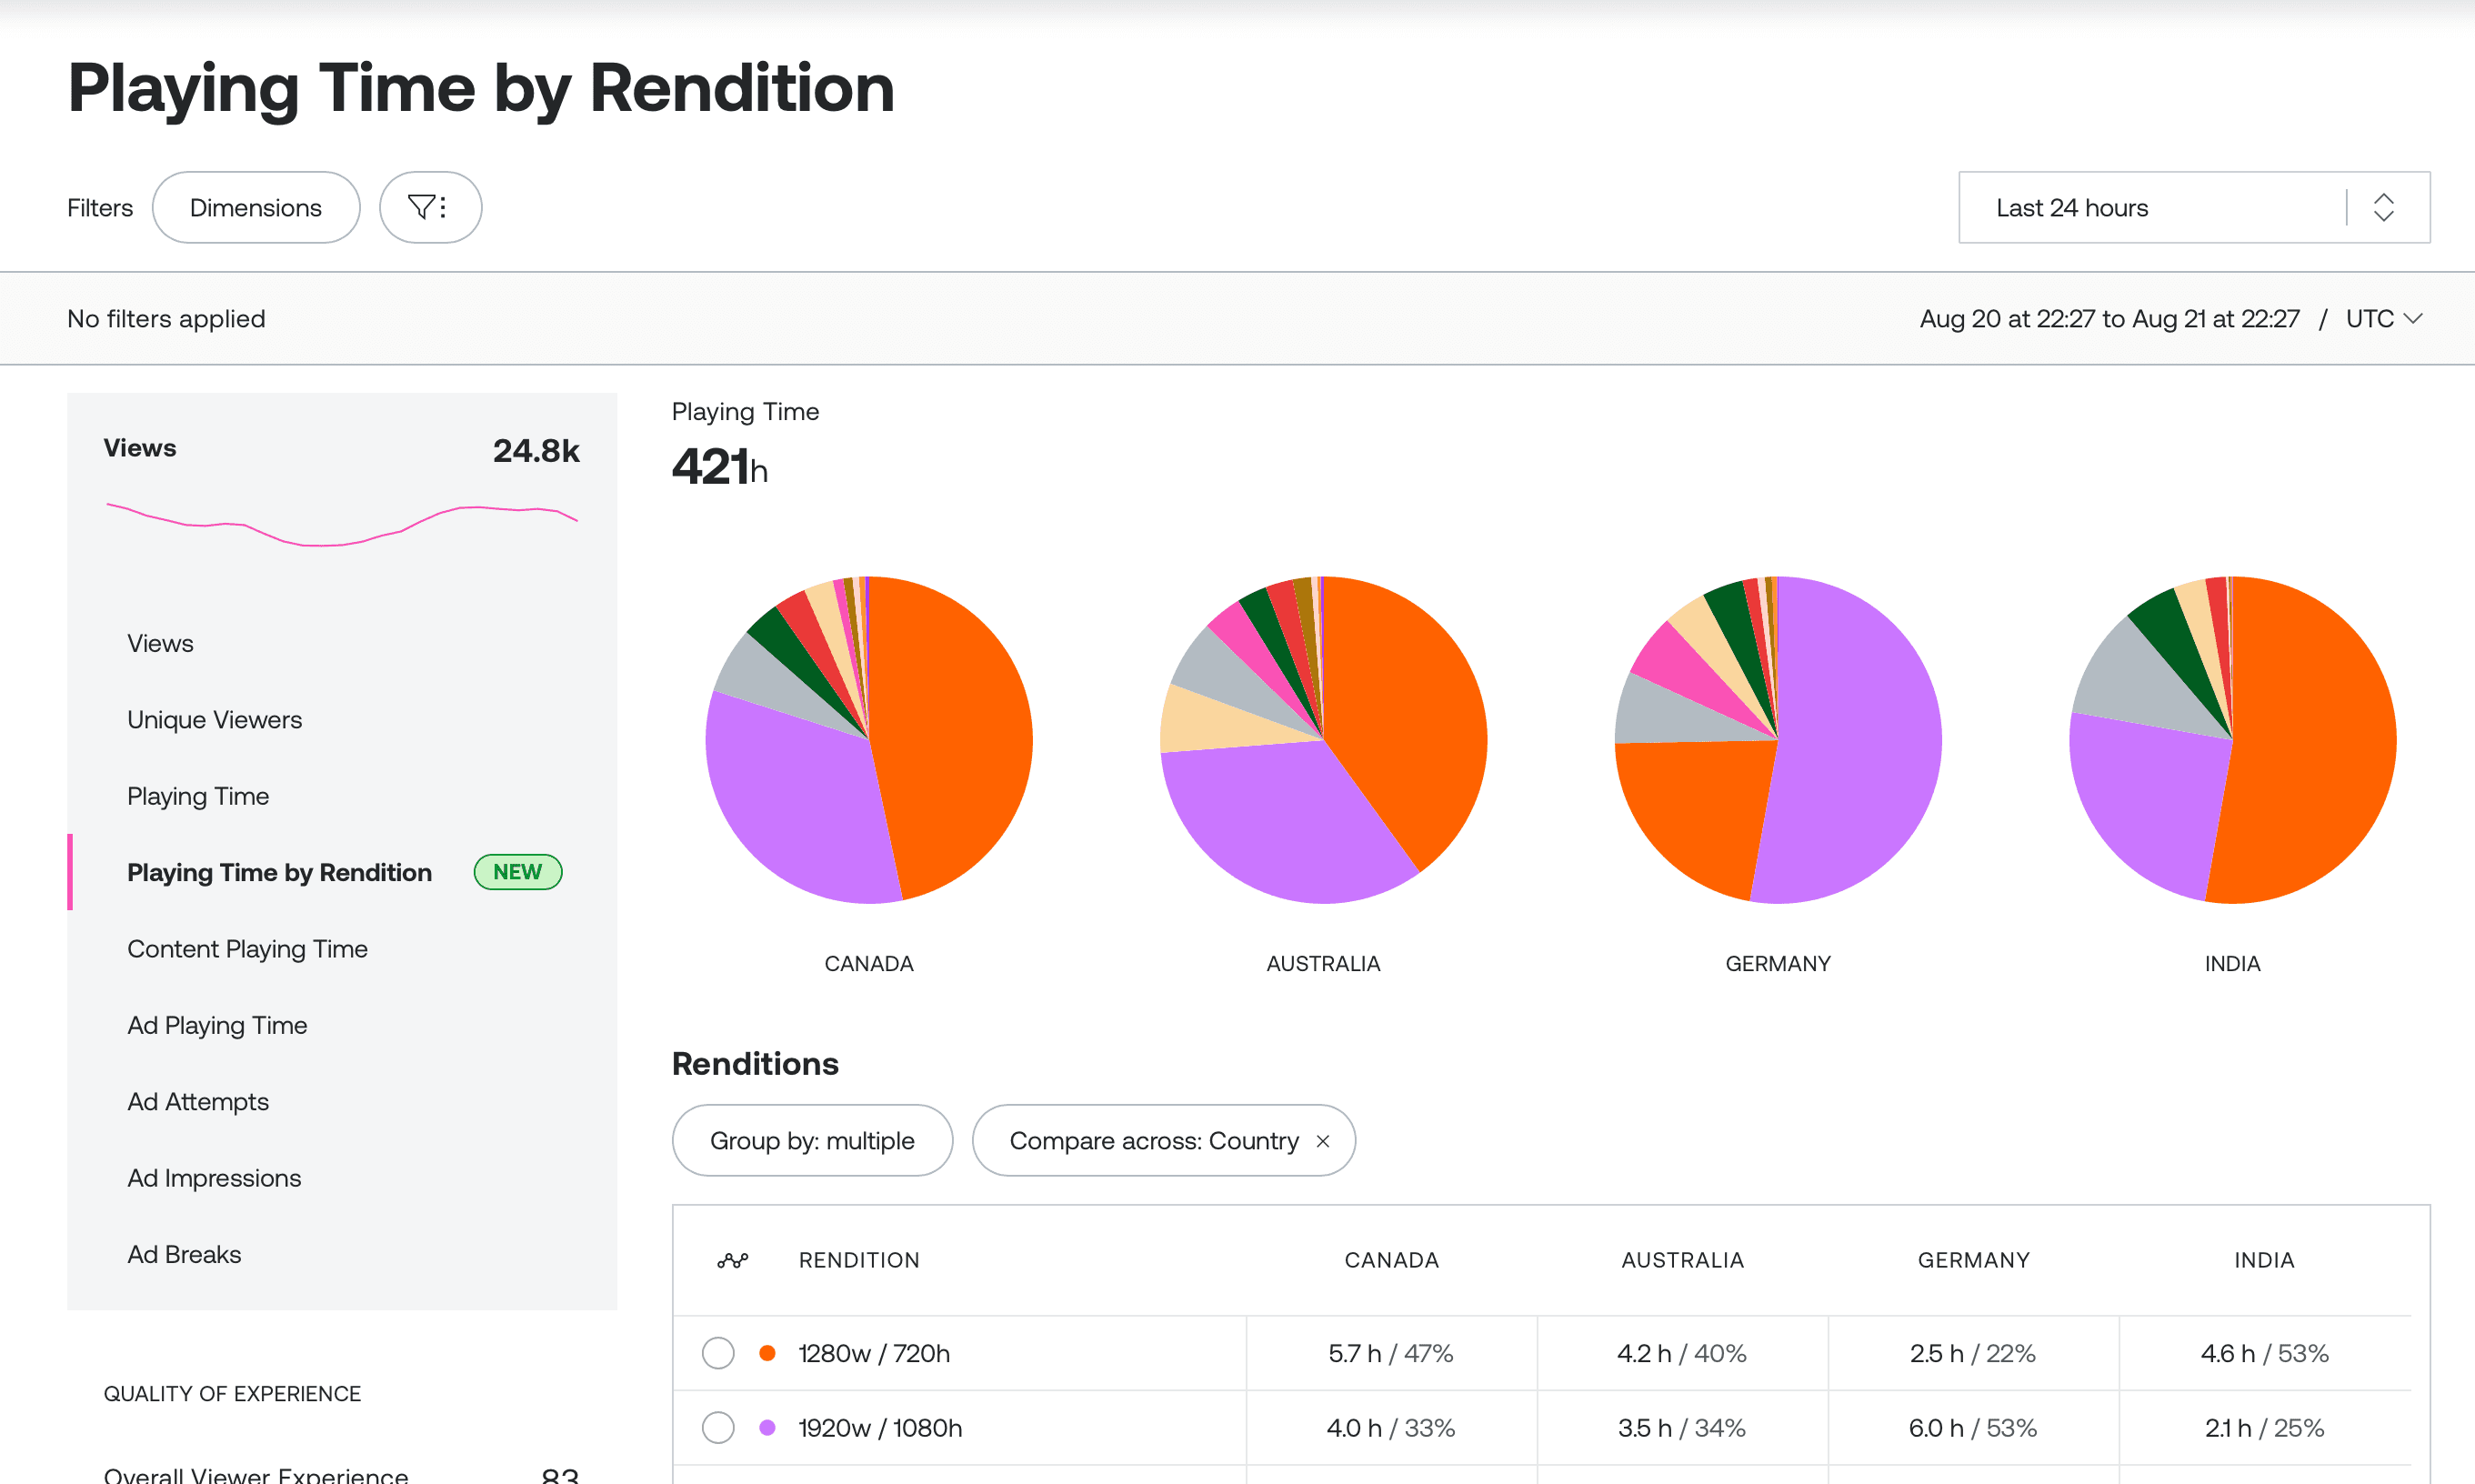
Each pie chart shows only the top 10 renditions by playing time for that value across the timeframe, with the rest folded into an other slice. To narrow the renditions shown instead of just capping the count, apply a rendition filter (for example, restrict to a resolution or codec) before comparing across a dimension.
Using the API
curl 'https://api.mux.com/data/v1/subview-metrics/playing_time/rendition/comparison?dimension=video_title&timeframe[]=30:days&values[]=Title%20A&values[]=Title%20B' \
  -u ${MUX_TOKEN_ID}:${MUX_TOKEN_SECRET}
{
"data": [
{
"dimension_value": "Title A",
"values": [
{
"breakdown_value": "18.5Mb / 3840w / 2160h / 60fps / HEVC",
"metric_value": 112000000,
"group_by_values": [18.5, 3840, 2160, 60, "HEVC", ""]
},
{ "breakdown_value": "other", "metric_value": 14700000 }
]
}
],
"meta": {
"dimension": "video_title",
"subview_type": "rendition",
"metric": "playing_time",
"unit": "ms",
"group_by": [
"video_source_bitrate",
"video_source_width",
"video_source_height",
"video_source_fps",
"video_source_codec",
"video_source_rendition_name"
]
},
"total_row_count": 2,
"timeframe": [1617235200, 1617321600]
}dimension and values[] are both required — the request returns a 400 without them. values[] is limited to 4 values. Use breakdown_value_limit (default 10, max 100) to control how many rendition rows are returned per dimension value before the rest are folded into an other bucket.
Filter your results
Playing time by rendition supports the same dimension filtering as the rest of Mux Data.
In the dashboard
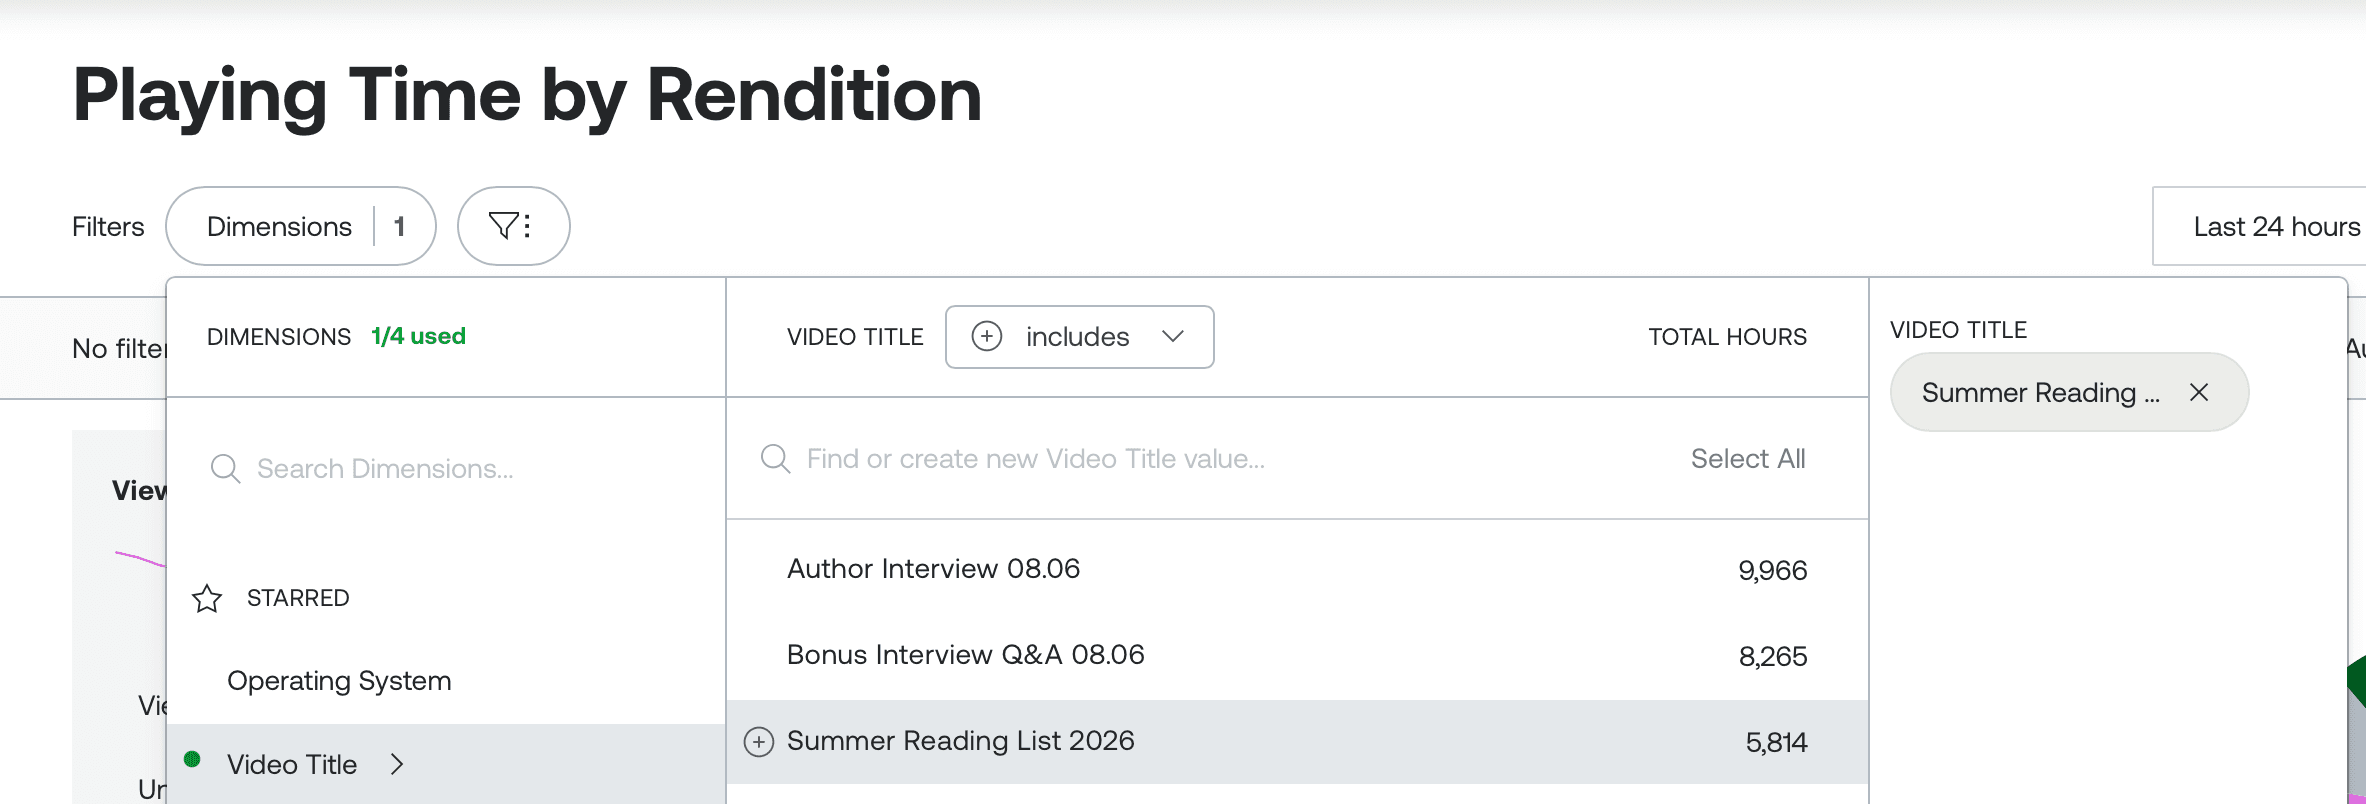
Use Filters in the page header to filter by any supported dimension, including rendition attributes like resolution. See Filter your data for the general filtering pattern.
Using the API
Pass one or more filters[] parameters in dimension:value format on any endpoint. Prefix with ! to negate:
curl 'https://api.mux.com/data/v1/subview-metrics/playing_time/rendition/breakdown?timeframe[]=30:days&filters[]=country:US&filters[]=video_source_width:1920' \
  -u ${MUX_TOKEN_ID}:${MUX_TOKEN_SECRET}
Filterable dimensions include a defined subset of view-level dimensions (like country and viewer_device_category) as well as rendition-specific dimensions such as video_source_height, video_source_width, and video_source_bitrate. Use filters[]=dimension:__empty__ to match rows where the dimension has no value.
Available dimensions and values
To build your own dimension pickers, or see what values are available for a filter or a dimension comparison, use the dimensions endpoints — these power the dropdowns in the dashboard's Filters and Breakdown by controls.
curl 'https://api.mux.com/data/v1/subview-metrics/rendition/dimensions' \
  -u ${MUX_TOKEN_ID}:${MUX_TOKEN_SECRET}
{
"data": {
"view": [
"video_id",
"video_title",
"video_encoding_variant",
"video_variant_name",
"player_name",
"player_version",
"client_application_name",
"client_application_version",
"mux_embed",
"mux_embed_version",
"sub_property_id",
"player_autoplay",
"viewer_device_category",
"viewer_device_name",
"viewer_device_model",
"operating_system",
"video_creator_id",
"cdn",
"continent_code",
"country",
"region"
],
"subview": [
"video_source_bitrate",
"video_source_width",
"video_source_height",
"video_source_fps",
"video_source_codec",
"video_source_rendition_name"
]
},
"total_row_count": null
}To see the top values for a specific dimension, ranked by playing time:
curl 'https://api.mux.com/data/v1/subview-metrics/rendition/dimensions/video_title?timeframe[]=30:days' \
  -u ${MUX_TOKEN_ID}:${MUX_TOKEN_SECRET}
{
"data": [{ "value": "Title A", "playing_time": 186400000 }],
"meta": { "subview_type": "rendition", "dimension_name": "video_title", "metric": "playing_time", "unit": "ms" },
"timeframe": [1617235200, 1617321600],
"total_row_count": 1
}Limitations
- Views recorded on Mux Data SDKs below the minimum versions above won't contribute rendition-level playing time data.
- Comparing across a dimension is capped at 4 values per request.
- Historical (long-term) time ranges aren't supported yet — standard time ranges only at launch.
- All Subview Metrics endpoints are read-only.