I can’t believe that three years ago was the last time I wrote on our blog and I shared how we are Monitoring and Architecting for Failure at Mux. In that post, I shared a story of a failure in our Mux Data product and some high-level reliability concepts. In this post, I’ll dig into a couple of topics in that post with more details related to two Mux Video outages.
Before we get into those topics, everyone knows that outages suck. We’d rather be transparent and honest and learn from our mistakes than hide incidents when they happen. These are opportunities to learn, and we’re lucky enough to be afforded these opportunities because of our recent growth. As others have helped us get to where we are, we hope that sharing some of what we’ve learned along the way will help you. The following learnings and outages are related to real incidents we’ve had, but this is not a fully detailed public postmortem. See my previous post for questions we ask during postmortems to extract these kinds of learnings and other high-level strategies we consider when designing our systems.
Outage 1 - Connection pools and timeouts
If you have written software that stored state, chances are you have interacted with a database. To interact with that database, you likely used a connection pool to reduce that interaction’s latency. How do they help? Let’s quickly take a look at an example timeline of incoming requests to a connection pool. In this diagram, the lanes (like swimming lanes in a pool) are database connections and our x-axis will represent time. There are four total Each of the boxes represents a request that the pool is handling.
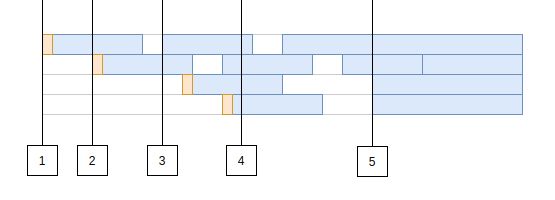
The first request comes in and we have no active connections, so we pay a little overhead to open our connection and start a session with the database. This is the orange bit at the front of the first request.
- Another request comes in while the first one is underway, so we need a new connection. We repeat the process: open a connection and start a session.
- We receive another request. We have 1 idle connection that we can reuse in our pool so this request saves that bit of overhead and runs a bit faster, even though the actual database query timing is exactly the same.
- Traffic is ramping up and now all of our connections are in use. Throughput relies on our connections freeing up so we can handle new requests.
- It happened. Maybe a new user just went live without you knowing what load they could add to your system or maybe it was something else. In this example, our tiny connection pool of 4 was using 2 connections and it just received 3 more requests! There are now more requests in flight than the connection pool can handle.
What happens now?
The application server starts taking on requests that it has to hold on to in memory while it waits for the connection pool to give it a chance to run the database query it needs. The application server starts chewing up RAM holding on to these requests. Is it going to stop? If you configured your requests with timeouts and the load doesn’t continue to build on your server forever, hopefully it will indeed stop and you look at your graphs to find something like we saw:

So what about that outage? Well the timeouts were working and the server didn’t run out-of- memory (OOM). Awesome! Sadly this is not an awesome story. The underlying database queries that were consuming all of the connections never completed. All the requests to this application server just timed out and were returned as errors due to our 99.99 percentile latency increasing. These few slow requests ended up consuming all of the requests in our connection pool because the driver we were using to interact with CockroachDB from our go application didn’t cancel the query to the database. Make sure your query timeouts propagate to your database and actually free the resources there too!
Outage 2 - Timeout. Retry. Give up?
Suppose a server ran out of memory in the middle of handling your request and crashed. Bummer. Maybe a timeout was reached somewhere in your client application and you really needed that reply from the server (video segment maybe?). Slap a retry on it?
Careful.
If this is not done carefully you might end up with a thundering herd that completely overloads your system in sharp intervals.

Retries come in layers in many applications. In video players, the client will frequently retry requests for segments due to the occasional 503 where the CDN to origin network has issues, for example. We’ve seen this kind of network issue coupled with client retires add a ton of load to our application in the past. In order to help our customers’ players retry better, Phil recently explained how a retry can actually go to a different CDN so you can survive everything from the occasional network hiccup to complete CDN failures.
I am not going to go into retry theory because that is well explained by others out there. In this case, our retries were configured well enough such that we were able to recover reasonably quickly without overloading the system.
Quick recoveries don’t cut it for a live video streaming api. They cut the stream.
Forget about those 99.99% uptime conversations; our customers expect 100% uptime for their live streams. We are always handling live streams. Anyone that is familiar with the concept of measuring reliability will tell you 100% uptime is simply not possible, but we need to do better than 99.99% because our customers do not want their streams to stop for 8 seconds every day. In order to accomplish this, as much as possible, we need to design our systems to tolerate failures at every layer.
In this case, we actually found a layer with a misconfigured timeout. If it had been tuned correctly, the system could have failed open. Failing open would result in a fallback to stale data and maybe some retries in the services downstream of the storage system, but we could have sufficiently prevented the outage and instead only had about a 1 second increase in median latency.
The scenario was a call that downstream systems have a 2 second timeout on. The internal calls must return within a total of 2 seconds or the downstream system will error the call, try to do some retries of that call, and then fail the request. Let’s dig into the details of this complex layered timeout scenario.
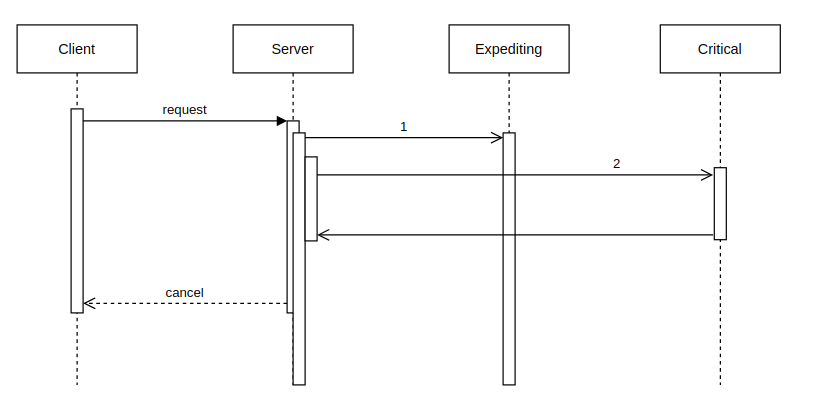
In this diagram, the client places a request to our server that has two backends. One backend is critical; we should be able to tolerate the failure of the other. We’ll call that non-critical backend the expediting backend as its job is to speed up the call and reply faster than the parallel call to the critical system. Most of the time the expediting backend does this well, but right now is not one of those times. It’s stalling. The server’s request (1) to the expediting backend takes longer than the server’s request (2) to the critical backend. The expediting backend’s timeout is configured for longer than the 2 second time between the request and the client canceling the request from its own timeout expiring.
Our old timeout values would have made sense if we were dealing with something like this simple “one call to each” situation, but the server isn’t this simple. It has looping calls to the expediting backend based on replies from the critical server. It looks more like this:
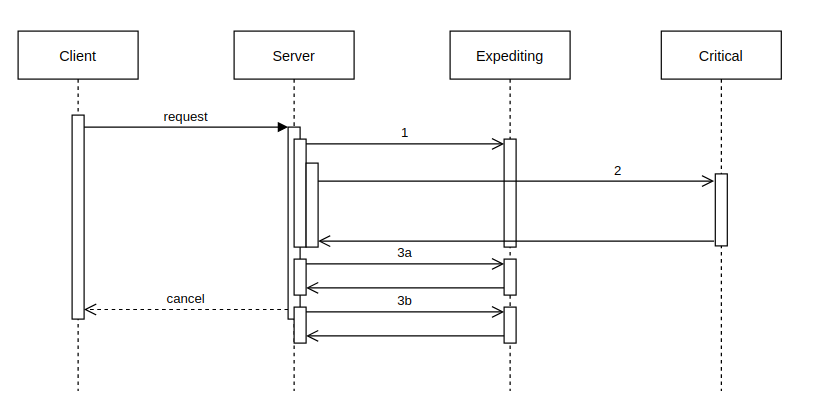
The critical backend returns a list of 2 items that should be decorated with data from the expediting backend if available. It is available for call 3, but it is slow. When the first call (3a) runs it exhausts the timeout of the client. The next item that wanted to be decorated by the expediting service (3b) succeeds but it is too late, the client has considered this an error.
Still with us? Let’s dive in even deeper. We can write and solve a formula that expresses this functions’ timeouts: max(call_1, call_2) + (call_2_items * call_3)
In order to correctly solve for the timeout values here, we need to understand call_2_items and then we need to make sure this expression evaluates to < 2 seconds. We effectively used Prometheus histograms to re-tune these timeouts after our recent incident. In this case we look at normal behavior to determine appropriate timeout values and can evaluate what % of requests would succeed for a timeout by using the “Apdex score” approach described in the Prometheus docs.
sum(rate(http_request_duration_seconds_bucket{le="0.3",job=”expedite”}[5m]))
/
sum(rate(http_request_duration_seconds_count{job=”expedite”}[5m]))
This PromQL expression helps us understand the % of requests that completed successfully in < 300ms. If this expression is near 100%, then maybe we want to use that 300ms setting for a timeout on the expedite service as it would not result in an unnecessary number of requests being “degraded” by not having the data. In our example, if we use this timeout for all calls then we can support only 5 items being returned as the loop call 3s’ to the expediting service would result in a total time of 1.8 seconds, just beating that client’s timeout and allowing a little bit of headroom for other application bits and pieces as well as potentially network timings.
Note that it makes a lot of sense to align your histogram configurations with your ideal/target timeouts values! Picking these values throughout your application requires careful thought, a little bit of math, a solid monitoring set up, and continuous review. This same kind timeout tuning may also be required in clients that retry calls to backend services. In these cases, rather than looping over response items to place calls, the loop that consumes our request’s time is attempts to get a response. With retries that are following best practices, it is much harder to solve for the timeout values because of the complexity of the function timing formula.
We’re always working to make our systems more reliable and carefully tuning these critical aspects of our system help to bring us closer to our goal of a perceived 100% uptime. If you like working through the details of complex operations and distributed systems problems and are interested in helping us hit that lofty goal, we’re hiring.

