Every video ingested into Mux goes through a prediction model to decide the encoder settings we'll use. The model is trained on statistics from every segment we've encoded over the last several years, which are recorded in our data warehouse. This Per-Title Encoding (PTE) model is built using both the loop of video statistics and other heuristics we've built over time (keep your eyes peeled for a dedicated blog post on this tech). It's the same instinct we later productized as Mux Robots: put the model inside the video pipes, where it has context, rather than alongside them.
That’s all well and good for making individual segments as efficient as possible, but what about making which renditions we serve more efficient? In some edge cases it might be more efficient to adjust how many or which renditions we offer on a case-by-case basis, but we’ve found that stability and predictability are substantially more valuable. So the rungs of the ladder stay put while the individual segment encoding settings fluctuate.
The evolution of basic
Our basic quality level has undergone several changes since we introduced it as “baseline” several years back. Within a year, we did a bit of product renaming, and then immediately added more features. We didn’t stop there. In Spring of 2025, we turned our wave of pricing improvements into a tsunami with the introduction of the Free plan. Oh yeah, and we continued to improve the quality and bitrates with our per-title encoding setup along the way.
One thing that held strong through all of that iteration was the deliberately simple ladder:
- 270p for viewers on limited networks or with small viewports
- 480p with plenty of bitrate to look pretty dang good as a middle tier
- 1080p for high-quality, full-screen viewing
There’s a pretty big jump from 480p to 1080p, but our reasoning was sound; fewer renditions means less to encode, less to store and manage, fewer objects to cache, and fewer variables for client apps to worry about. Simplicity is a planned feature.
But in practice, leaving 720p out of our basic ladder presented some real problems for viewers in the middle. Screen sizes, limited device capabilities or network speeds, and bandwidth caps limiting video streaming to “HD” — all mean viewers that would prefer a 720p experience got something a bit softer. On the other end, players may overreach to 1080p, risking rebuffering.
The simple solution, and its complex problems
Our first instinct was to keep the ladder at three rungs to preserve the simplicity, and keep costs low — swap out the lowest rung of 270p for the new middle of 720p landing on 480p / 720p / 1080p. We had a new ladder config prepped and ready for broad deployment.
At the same time, we were receiving user feedback suggesting we should actually be looking to lower the resolution/bitrate of our lowest tier to better serve viewers in rural areas, or those watching content on mobile while traveling to/from work, or in a tiny picture-in-picture window, or… (honestly, there’s a surprising number of use cases for really tiny video). For these scenarios, dropping 270p forces those views up to 480p when they don’t need or want it.
And now there’s an audience that didn’t exist when the ladder was crafted just a few years back: consumers that aren’t people. It’s not TV for Horses (soon, though…). This new audience is AI agents. Robots, if you will. One very important thing to know about running inference on video is that not many pixels are required. A model doing scene detection, tagging, moderation, or summarization gets essentially the same data from a small frame as a large one, and costs a good deal less to run. So the bottom rung has an additional benefit we hadn’t actually designed for. That audience is growing quickly, and deleting the cheapest rung to generate, serve, and process would have been an odd choice to make in 2026.
So do we keep 270p or drop it?
Two main questions
Two questions, both of which required an analytical approach to answer:
- What's the viewer experience impact of removing 270p?
- What's the cost impact of removing 270p?
To answer those without hand-waving, we pulled from the places that actually know: CDN, storage, and compute logs for the cost and delivery side, and Mux Data for quality of experience. Then we built an internal Encoding Ladder Decision Tool to model rendition changes against real cost data instead of guessing.
It was immediately apparent that simply removing 270p would roll a good number of views up to 480p at around double the bitrate. That means about double the cost (to us) to store and deliver those segments. While 480p is but a fraction of the cost of HD and above, doubling the usage rate would absolutely be enough to notice in the ledgers. But, again, it’s not quite that simple.
Fewer renditions should cache better. Every distinct rendition is another set of objects competing for room in CDN cache. If we collapse a tier, the survivors get requested more often, so a higher share of those requests will be served from cache rather than going all the way back to origin. So maybe killing 270p pays for itself through cache efficiency?
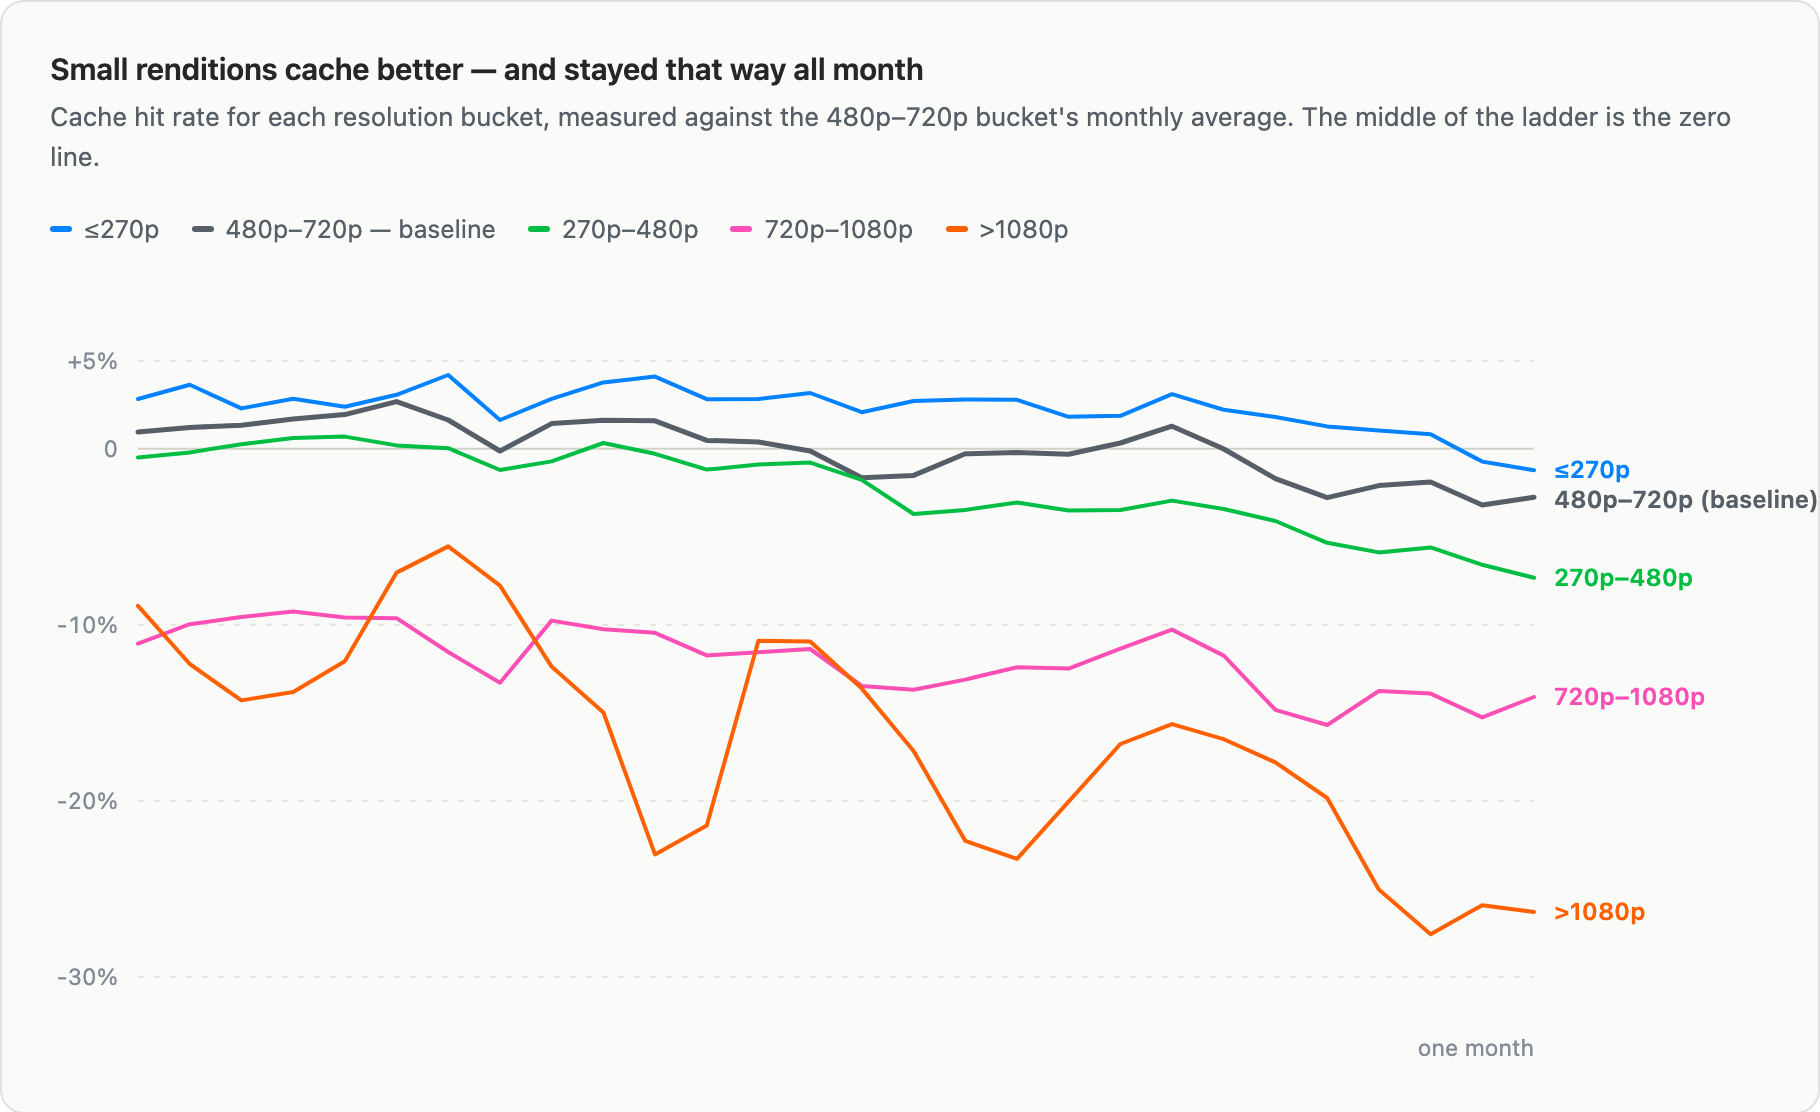
So what if all of those 270p requests are actually just sharding our 480p cache efficiency? A simple table showed a cost impact range between 10% savings and a 15% increase if we removed 270p, depending on how much 480p cache hit rates improved. It’s worth doing the detailed analysis and mapping actual asset by asset, segment by segment. Querying with such detail against 3 different sets of CDN logs takes a fair amount of time — so we set our window to all of February 2026 and went to lunch.
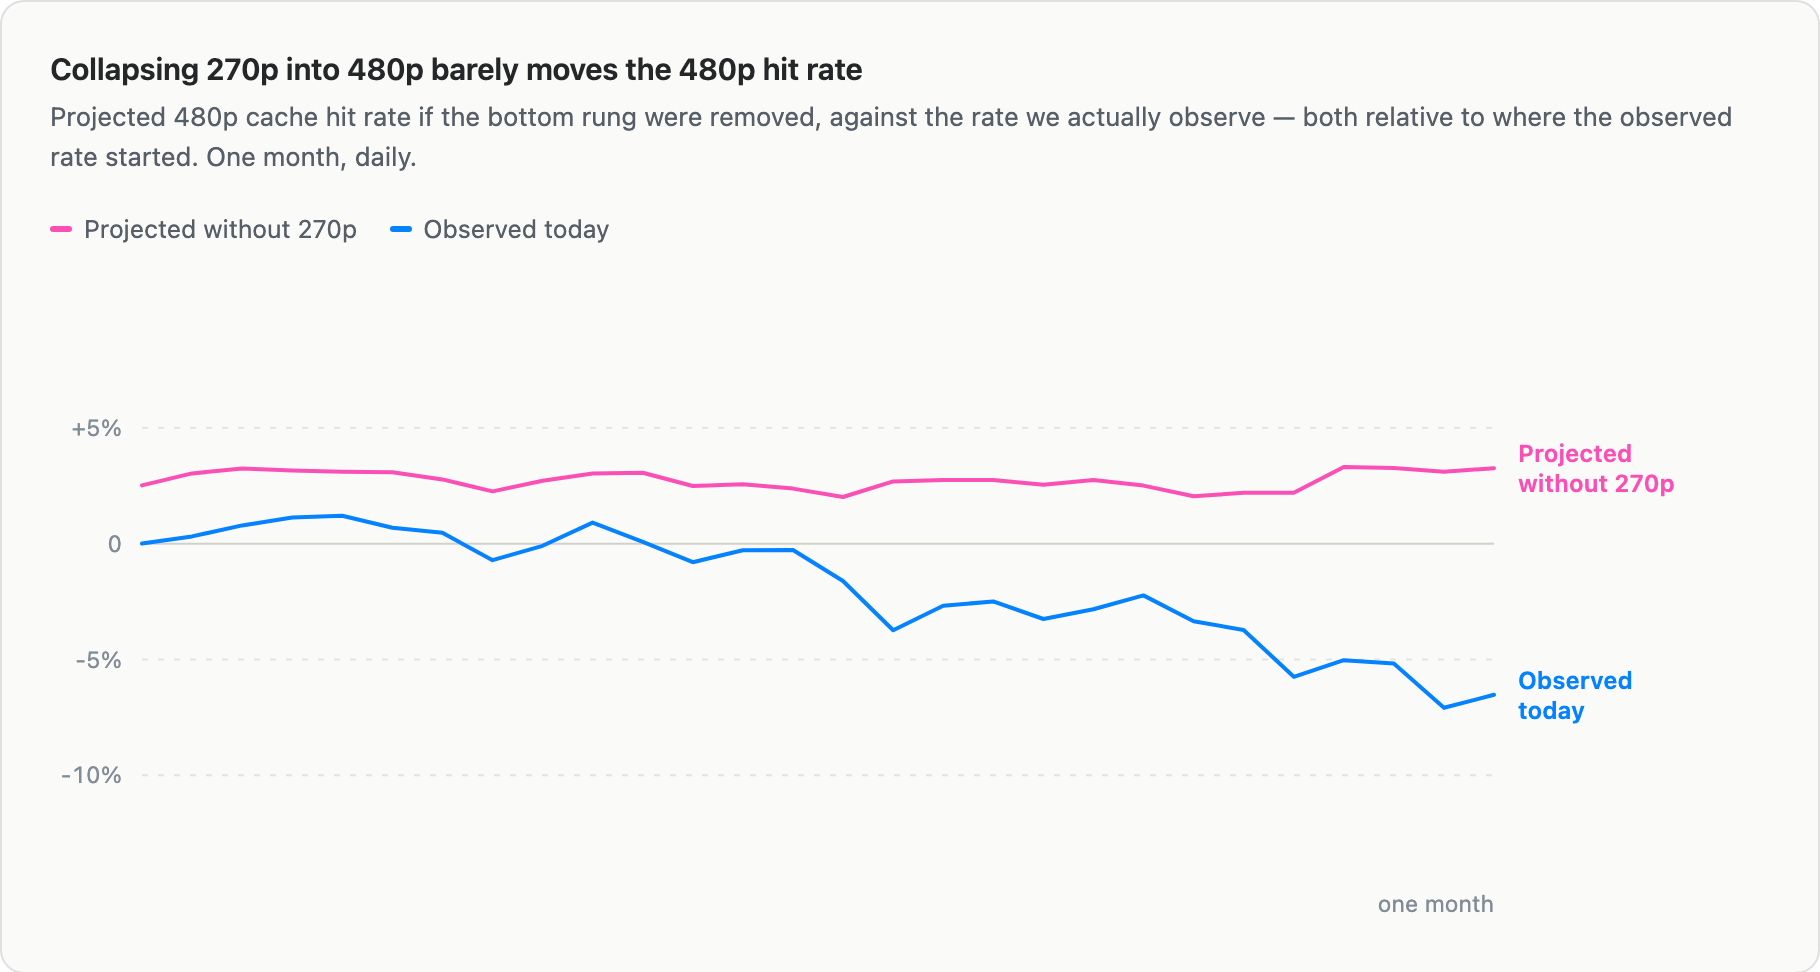
Empirical evidence shows that, for real traffic, there’s only a marginal gain to be had in cache efficiency from collapsing 270p into 480p. More requests against fewer objects do help, but mostly in variability of efficiency. In the most extreme scenario, we may break even.
Verdict: Keep 270p. It preserves the experience for the viewers who need it, it's the right rung for the consumers who aren't people, and collapsing it doesn't pay for itself.
What we shipped
The final current (until we improve it again) basic ladder for 1080p content: 270p, 480p, 720p, 1080p. We rolled it out in April behind feature flags so we could ramp gradually and watch the data come in.
The results
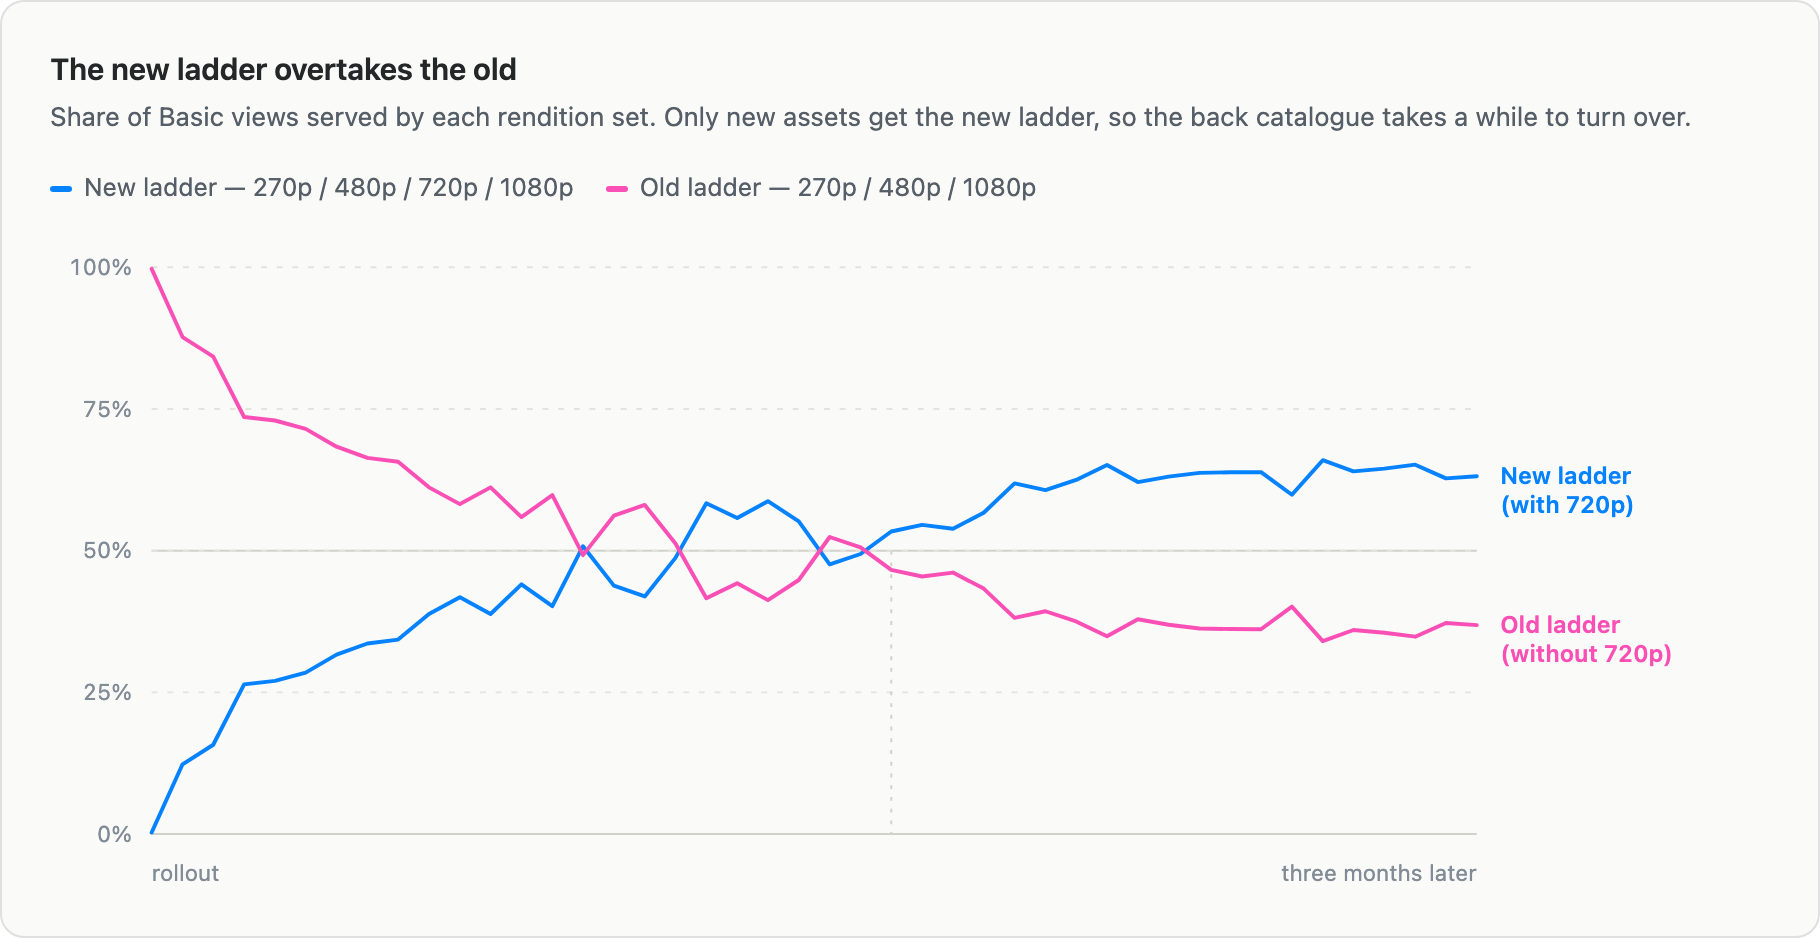
We maintain a pretty massive back-catalog of content, so any rendition set changes take a fair amount of time to show up as they’ll generally apply only to new assets. While we were able to pretty immediately measure the impact in compute, storage, and CDN — the QoE numbers took a bit longer to level out. It took a little over a month for the new default basic rendition set to become the leader:
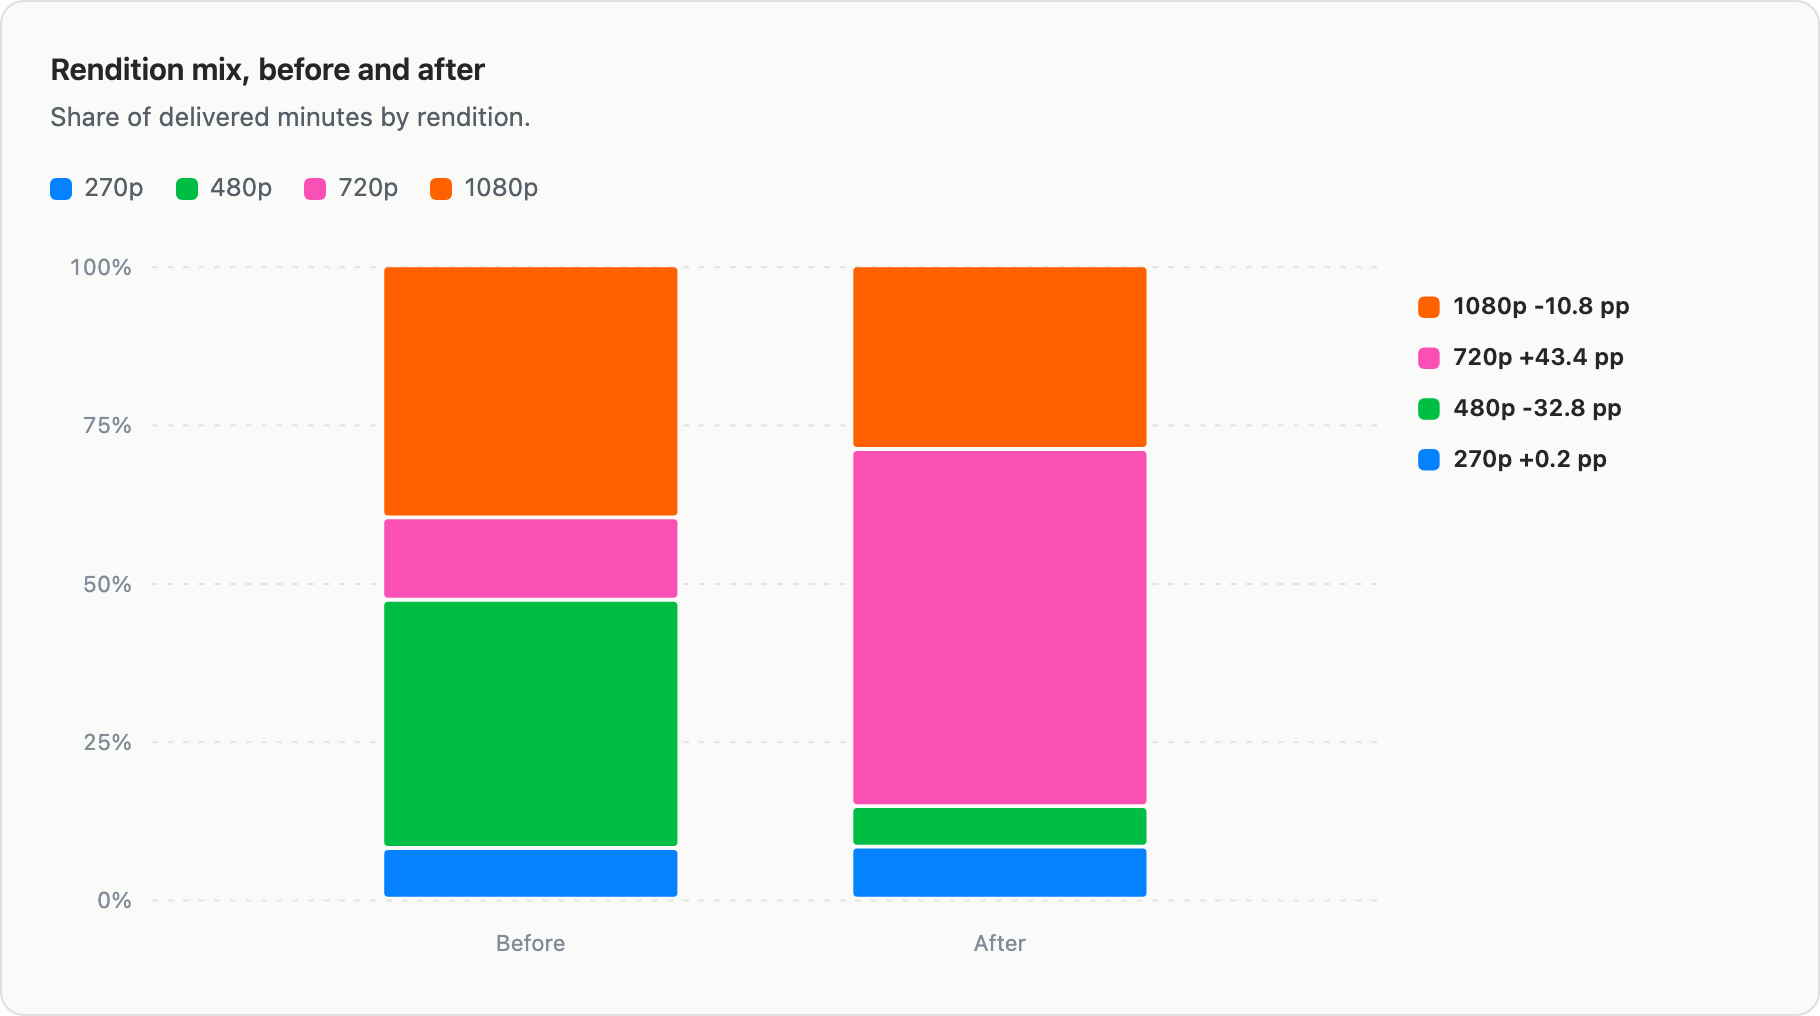
Comparing a month of basic delivery before the rollout in April to a month after:
Viewers moved to 720p, hard
720p went from about a tenth to about half of all delivered minutes on basic assets. It pulled in from both directions — 480p usage fell from roughly a third of minutes to single digits, and 1080p usage dropped meaningfully too.
Okay - we actually did a few experiments with adding 720p leading up to this full-commit. You’ll see evidence of that in a graph later on.
The safety net stayed put. 270p delivery barely moved. The low rung is still there and still getting used by the viewers who need it — which justifies the effort to understand and keep it.
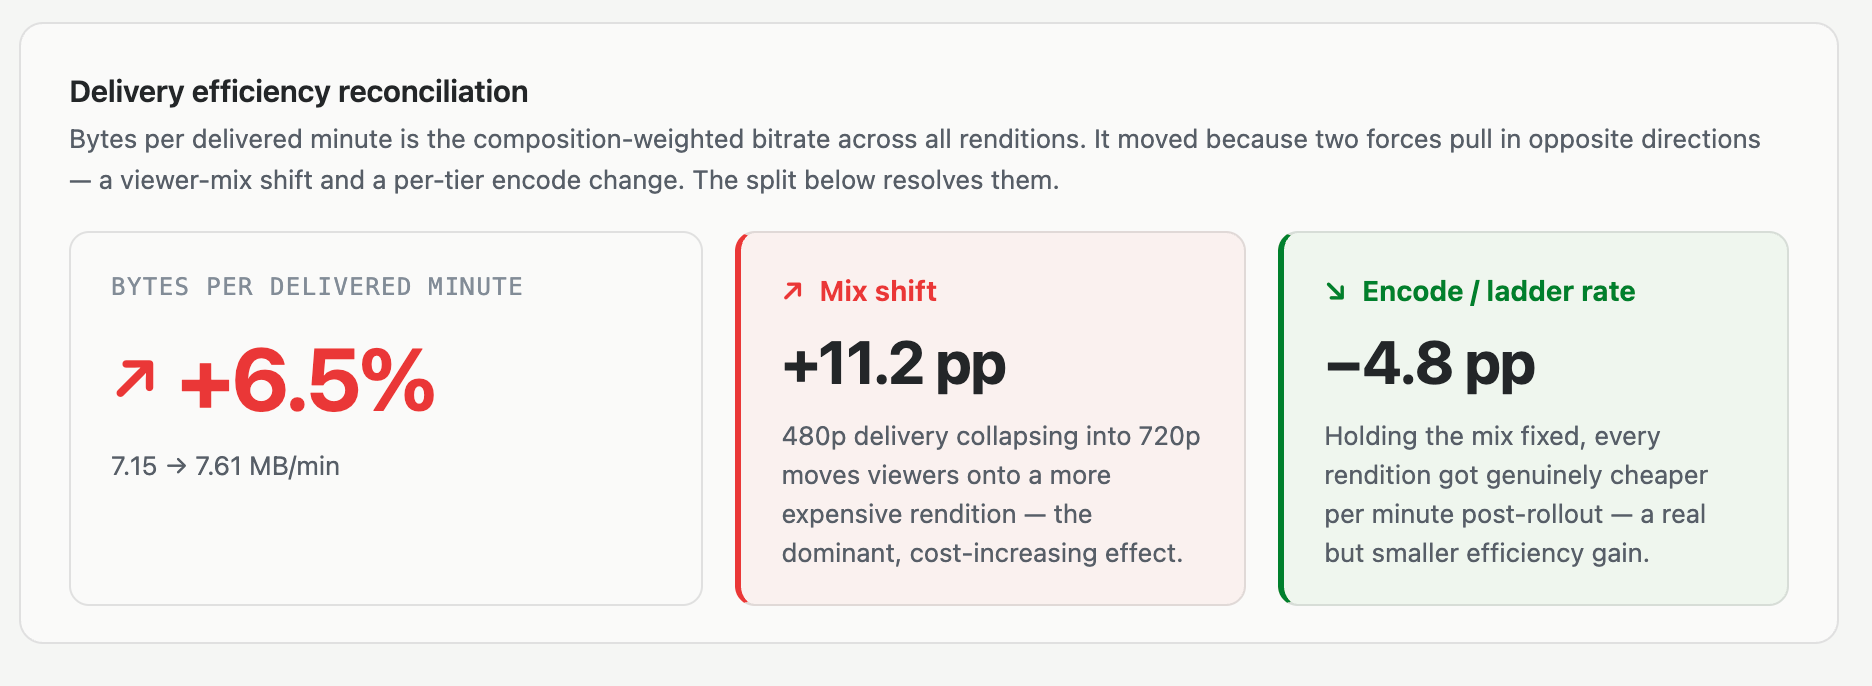
We delivered about 6.5% more bytes per minute. It seemed obvious that adding a rendition would add cost, but there remained a glimmer of hope that we’d come out of this actually serving fewer bytes. After all, while 480p to 720p is an increase, 1080p to 720p is a pretty substantial decrease in bytes. In reality, the views jumping from 480p to 720p far outweighed the number of views falling down from 1080p.
From the other direction, tuning our PTE took nearly 5% off that increase, without sacrificing visual quality. Not enough to “cancel out” adding 720p, but enough to bring the impact well below double digits.
Quality went up
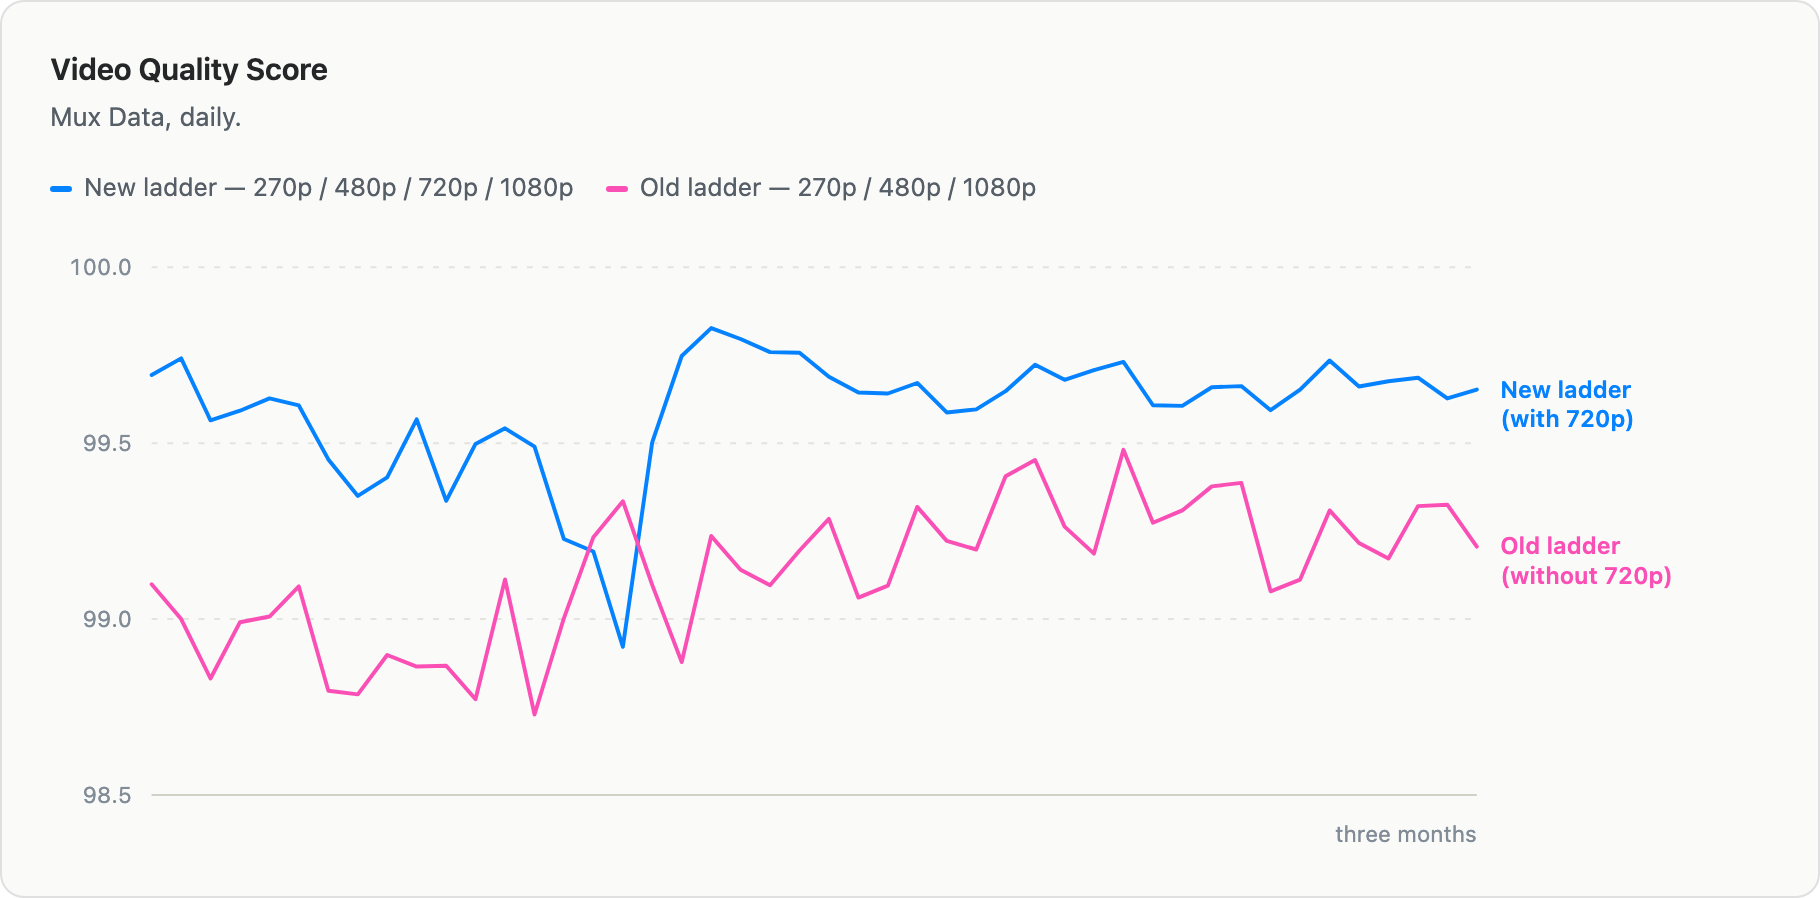
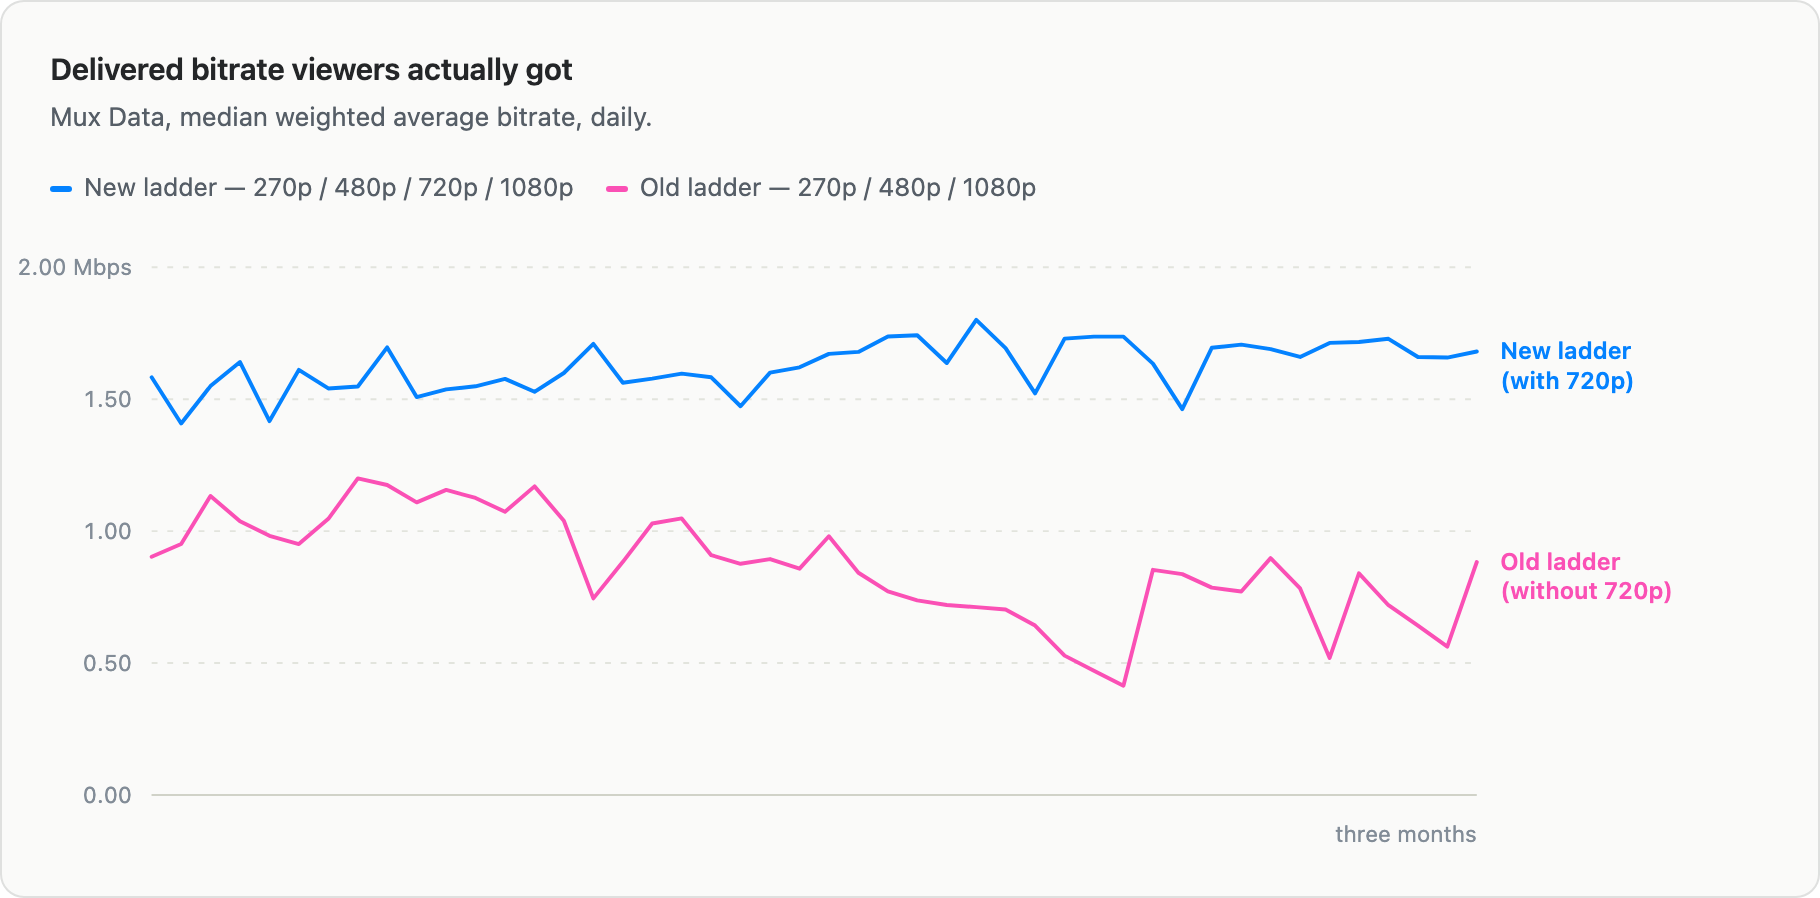
In Mux Data, the new ladder held a consistently higher Video Quality Score (about 99.7 versus 99.1 for the old one), and the median delivered bitrate that viewers actually experienced went up. Viewers are landing on a better-looking rung more often.
And it cost viewers nothing in latency
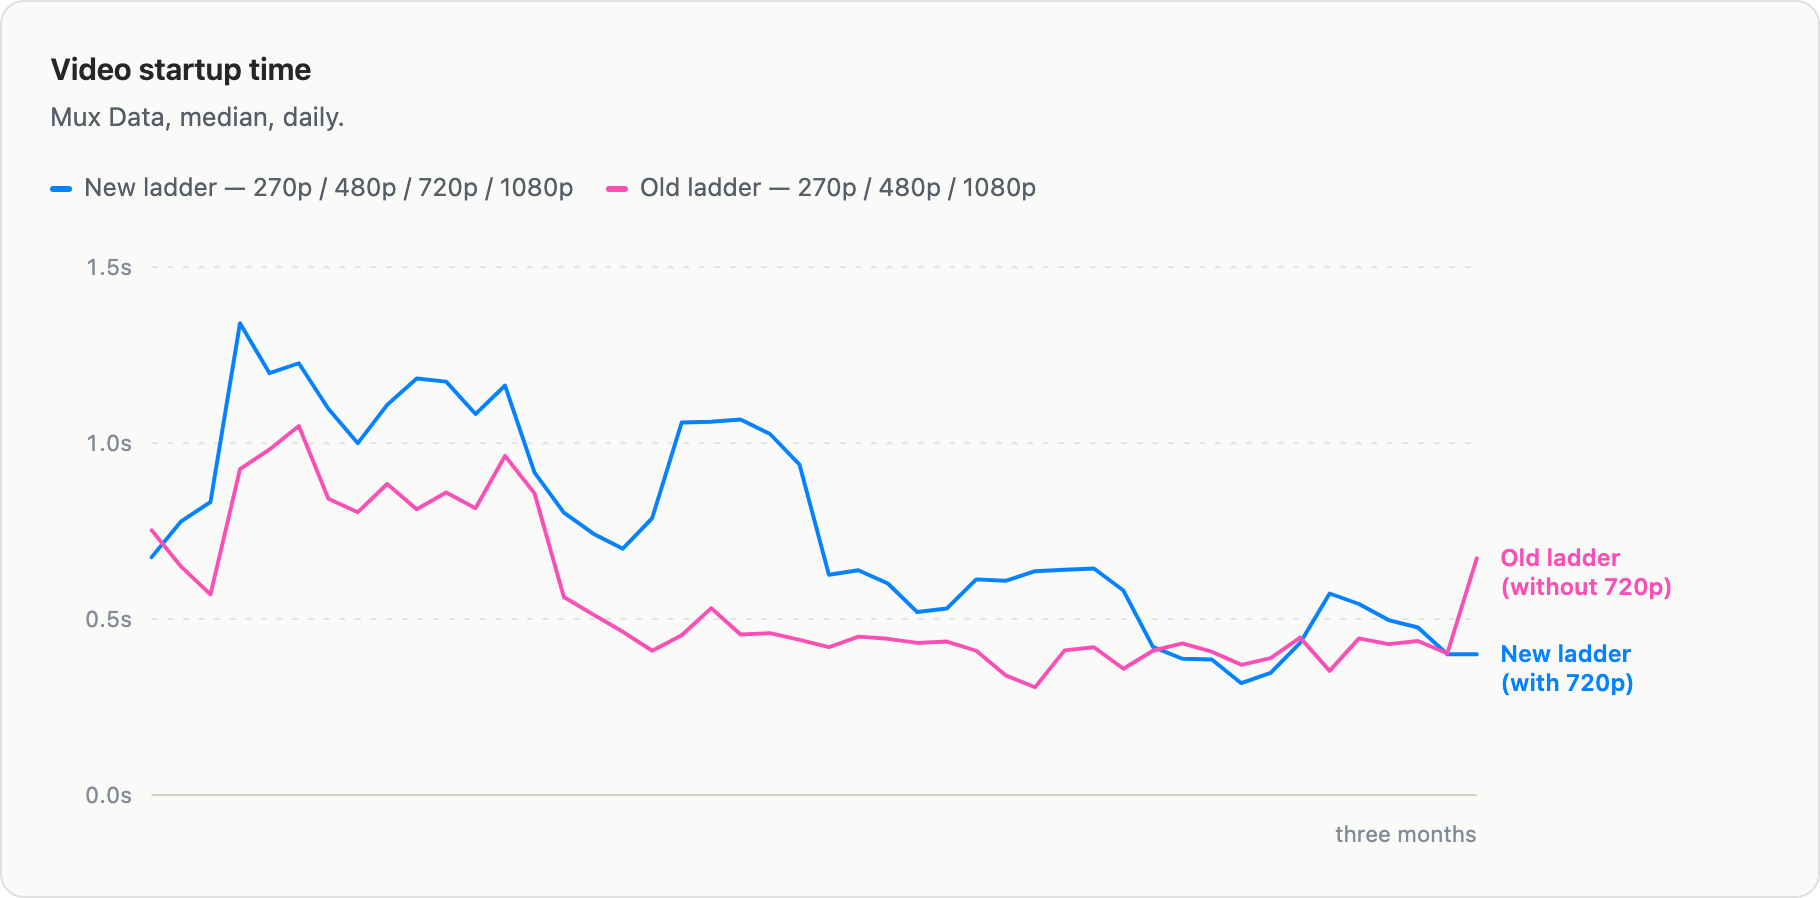
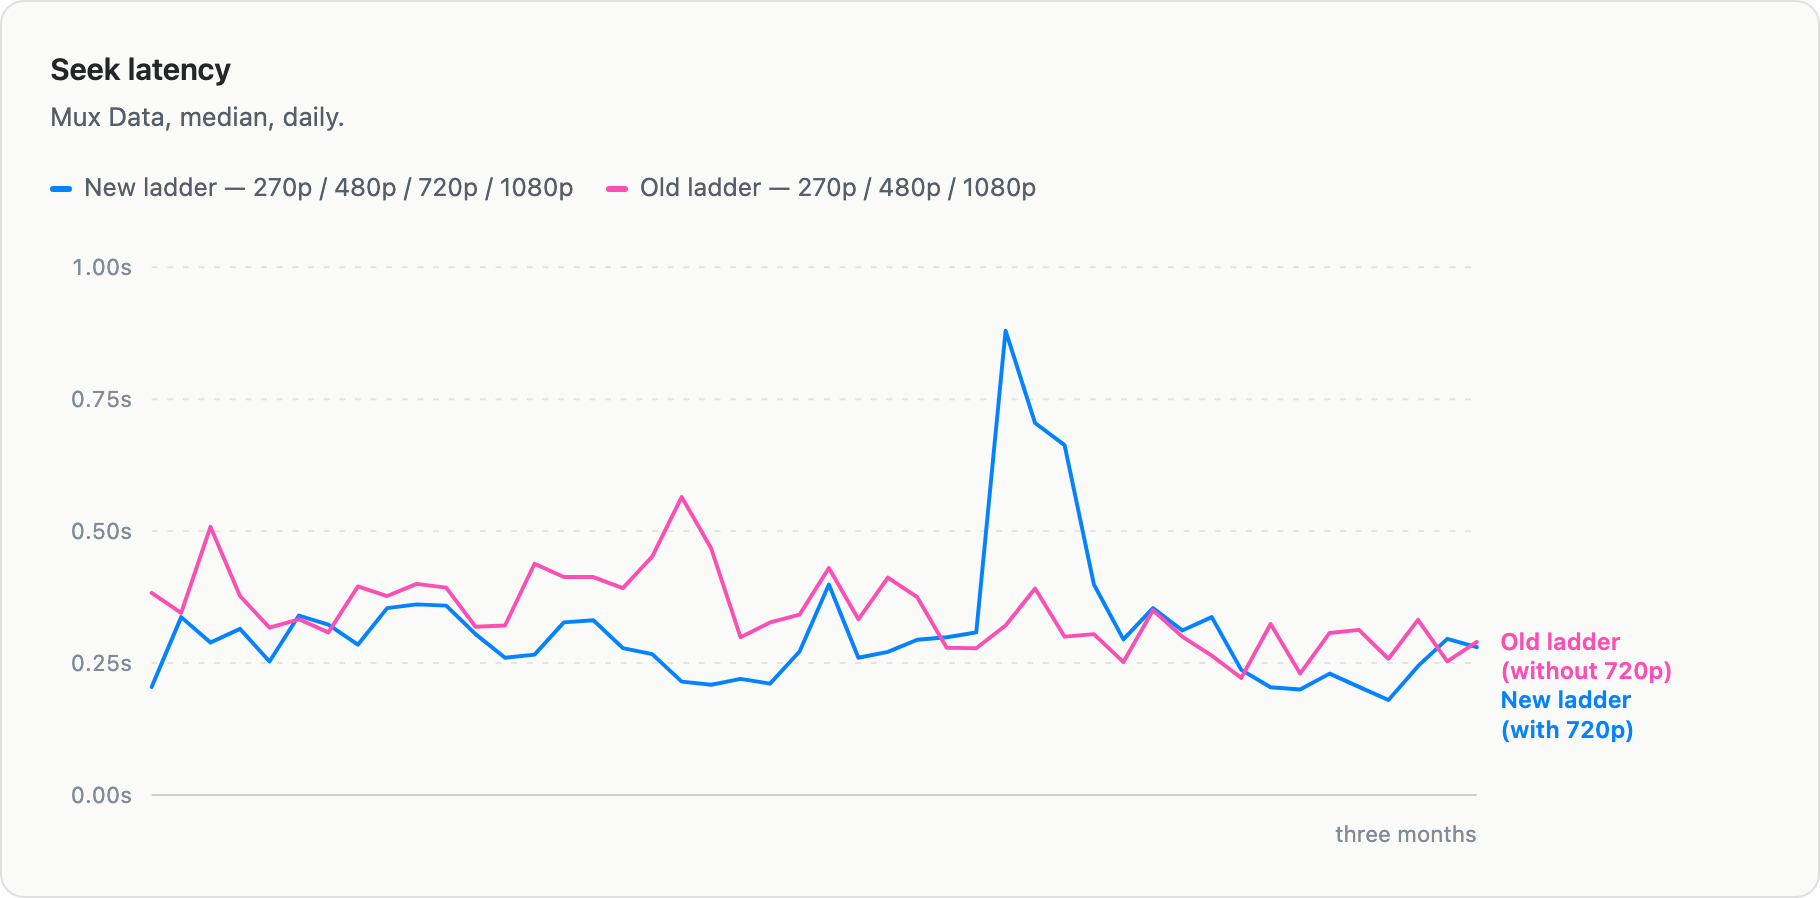
I'll be honest, we fully expected to take a hit here. A 720p segment carries more data than a 480p one, so it stood to reason that playback would start slower and seeks would drag. The data didn't agree: seek latency held flat while startup latency actually improved. Turns out other teams at Mux don’t sit around idle, and we’ve been making pretty significant improvements to our entire stack — like CDN selection, for example.
What matters is that the viewer analytics data is consistent in showing the quality jump came with no performance penalty.
The bigger customer win
It gets even better when we get into your invoice.
Mux prices delivery by resolution — 720p is a cheaper delivery tier than 1080p, because it's a fraction of the pixels. So watch what the ladder change does to the bill:
- Viewers who used to land on 1080p and now settle on 720p drop into the cheaper delivery tier.
- Viewers who used to sit at 480p and now step up to 720p stay inside the same low-cost bracket. They get a visible quality bump at no extra tier cost.
Both directions converge on 720p, and 720p is the sweet spot on both quality and price.
We're shipping more bytes than we were before, and our customers are paying us slightly less for them. That sounds like a mistake and isn't — it's how our pricing is supposed to work. This was a calculated product decision to give our customers what’s best for them.
This is where our dedication to data science pays off. Our first instinct was to drop 270p when adding 720p, to “keep it simple.” That would have double-dipped the rendition upshift costs while making the product worse. Keeping that rung in place is a good part of why this cost what it did instead of a good deal more, and the per-title encoding tuning is already handing some of it back.
What’s Next?
We built some shiny new tools for this effort, and we’re excited to continue using them to make better video experiences for all. Stay tuned for more!